Transform Data with AWS Glue DataBrew
Transform Data with AWS Glue DataBrew
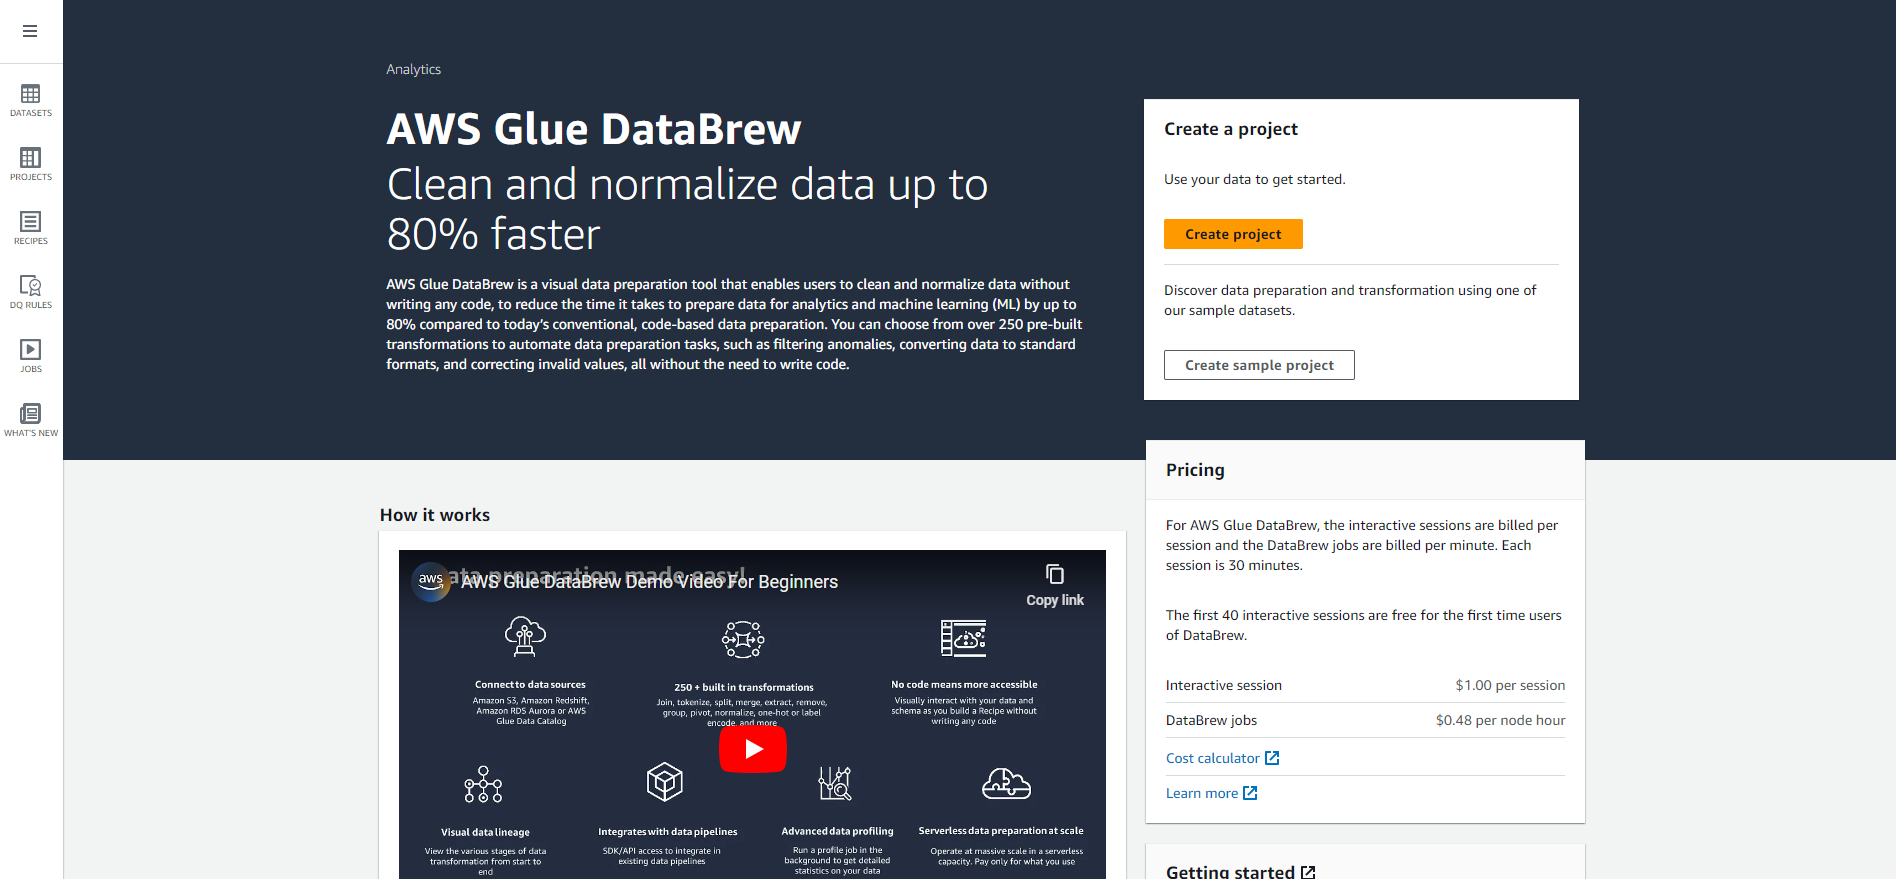
AWS Glue DataBrew is a new visual data preparation tool that makes it easy for data analysts and data scientists to clean and normalize data in preparation for analytics and machine learning. You can choose from over 250 built-in transformations to automate data preparation tasks, without writing code. You can automate outlier filtering, convert data to standard format, fix invalid values, and other tasks. Once your data is ready, you can immediately use it for analytics and machine learning projects. You only pay for what you use - no upfront commitments.
In this lab, we will be doing an ETL process similar to “Data Transformation with AWS Glue” (interactive session) but this time we will be using AWS Glue DataBrew.
What are the learnings from this module? Get hands-on with AWS Glue DataBrew, a visual data preparation tool that makes it easy for data analysts and data scientists to clean and normalize data in preparation for analytics and machine learning.
- Go to the Glue Databrew Console. Select Create project
- Enter the project name: AnalyticsOnAWS-GlueDataBrew as shown in the screenshot below.
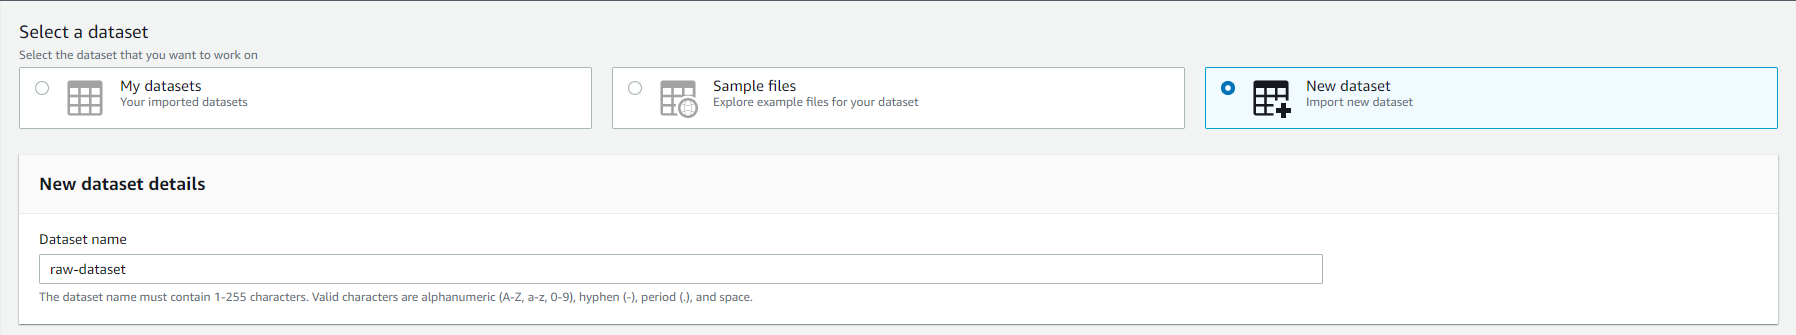
- Under Select a dataset, select New dataset
- In New dataset details, enter raw-dataset in the Dataset name box as shown in the image below.
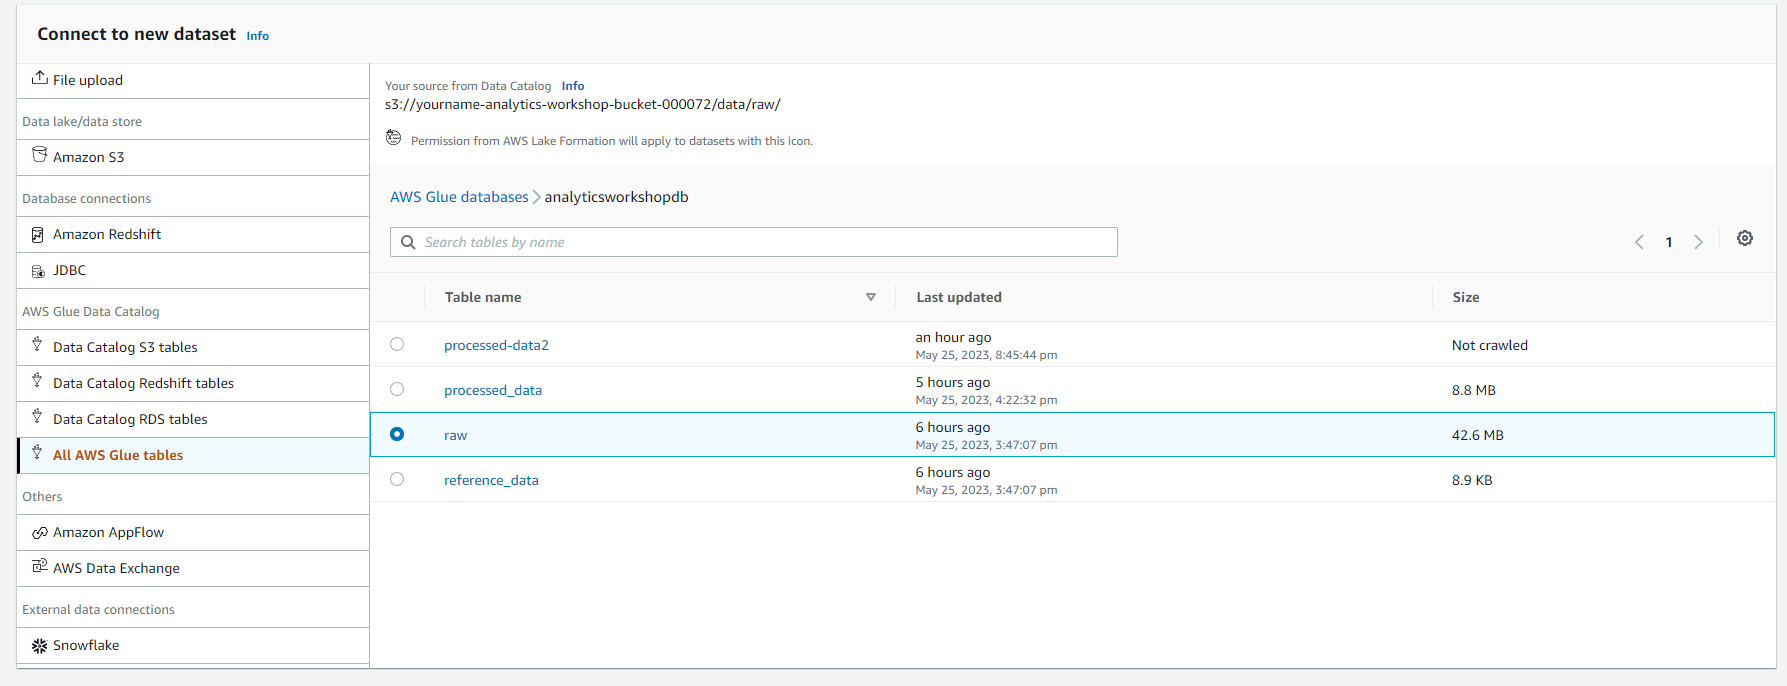
- Under Connect to new dataset
- Select All AWS Glue tables, you will see all the databases in the AWS Glue Catalog as shown in the screenshot below.
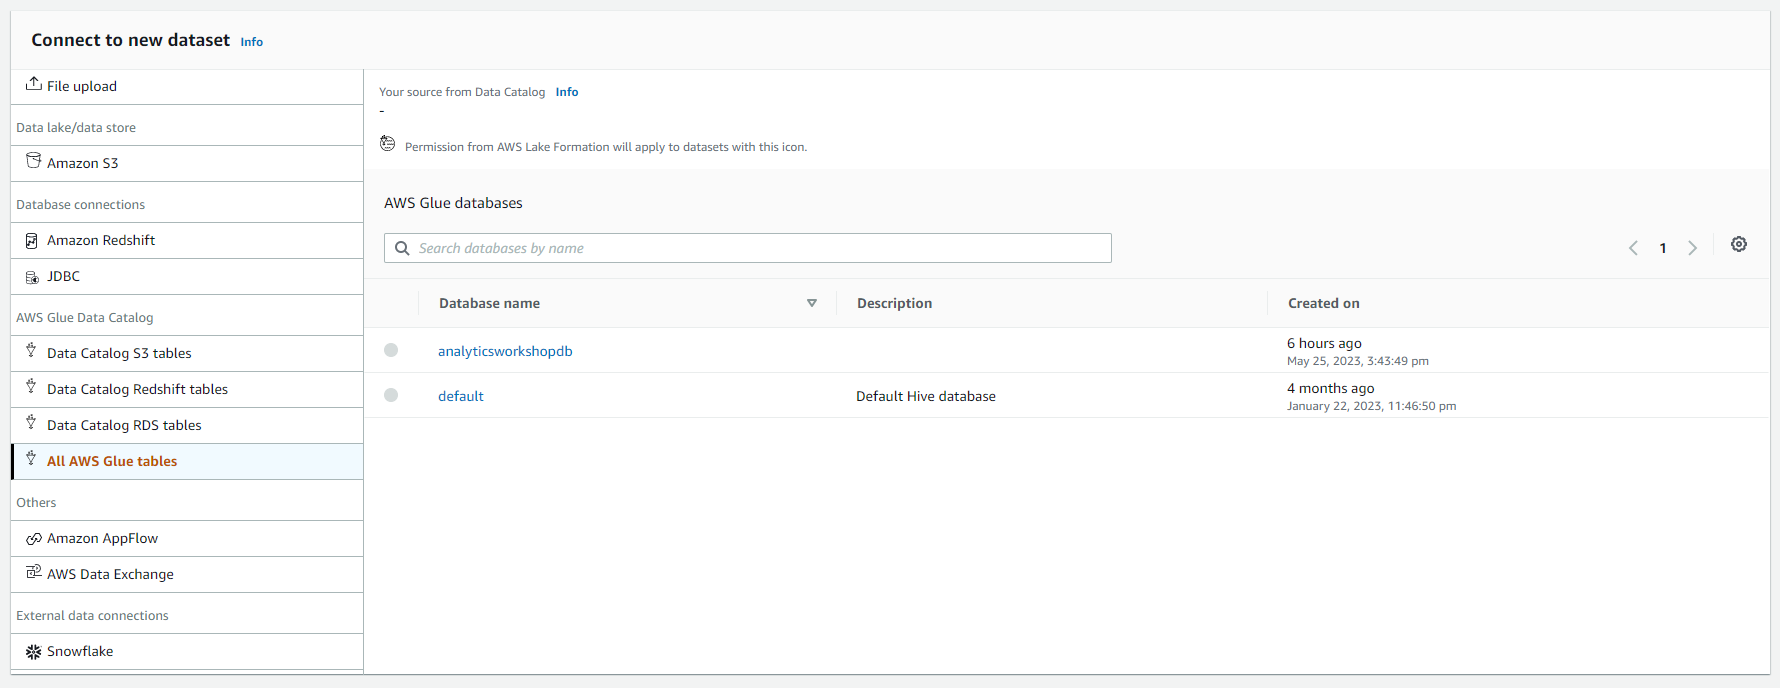
- Select analyticsworkshopdb. Select raw table
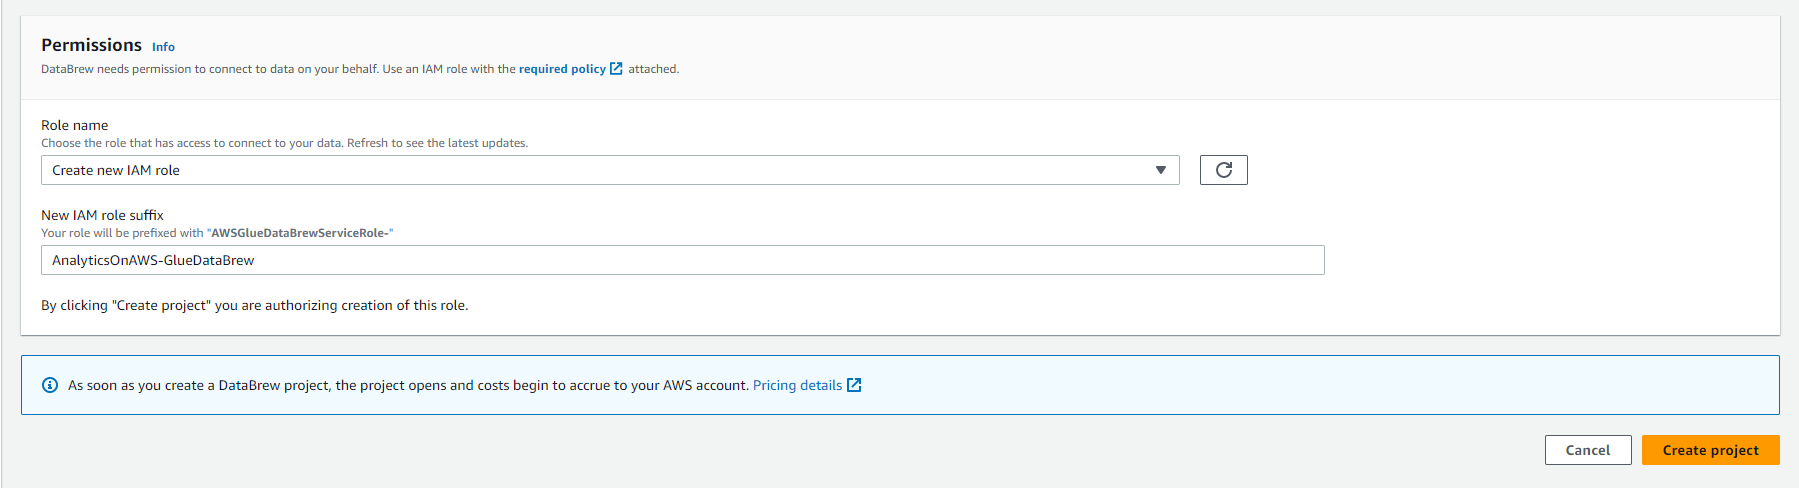
- Under Permissions
- Select Role name as Create new IAM role
- Import AnalyticsOnAWS-GlueDataBrew into New IAM role suffix
- Click Create project
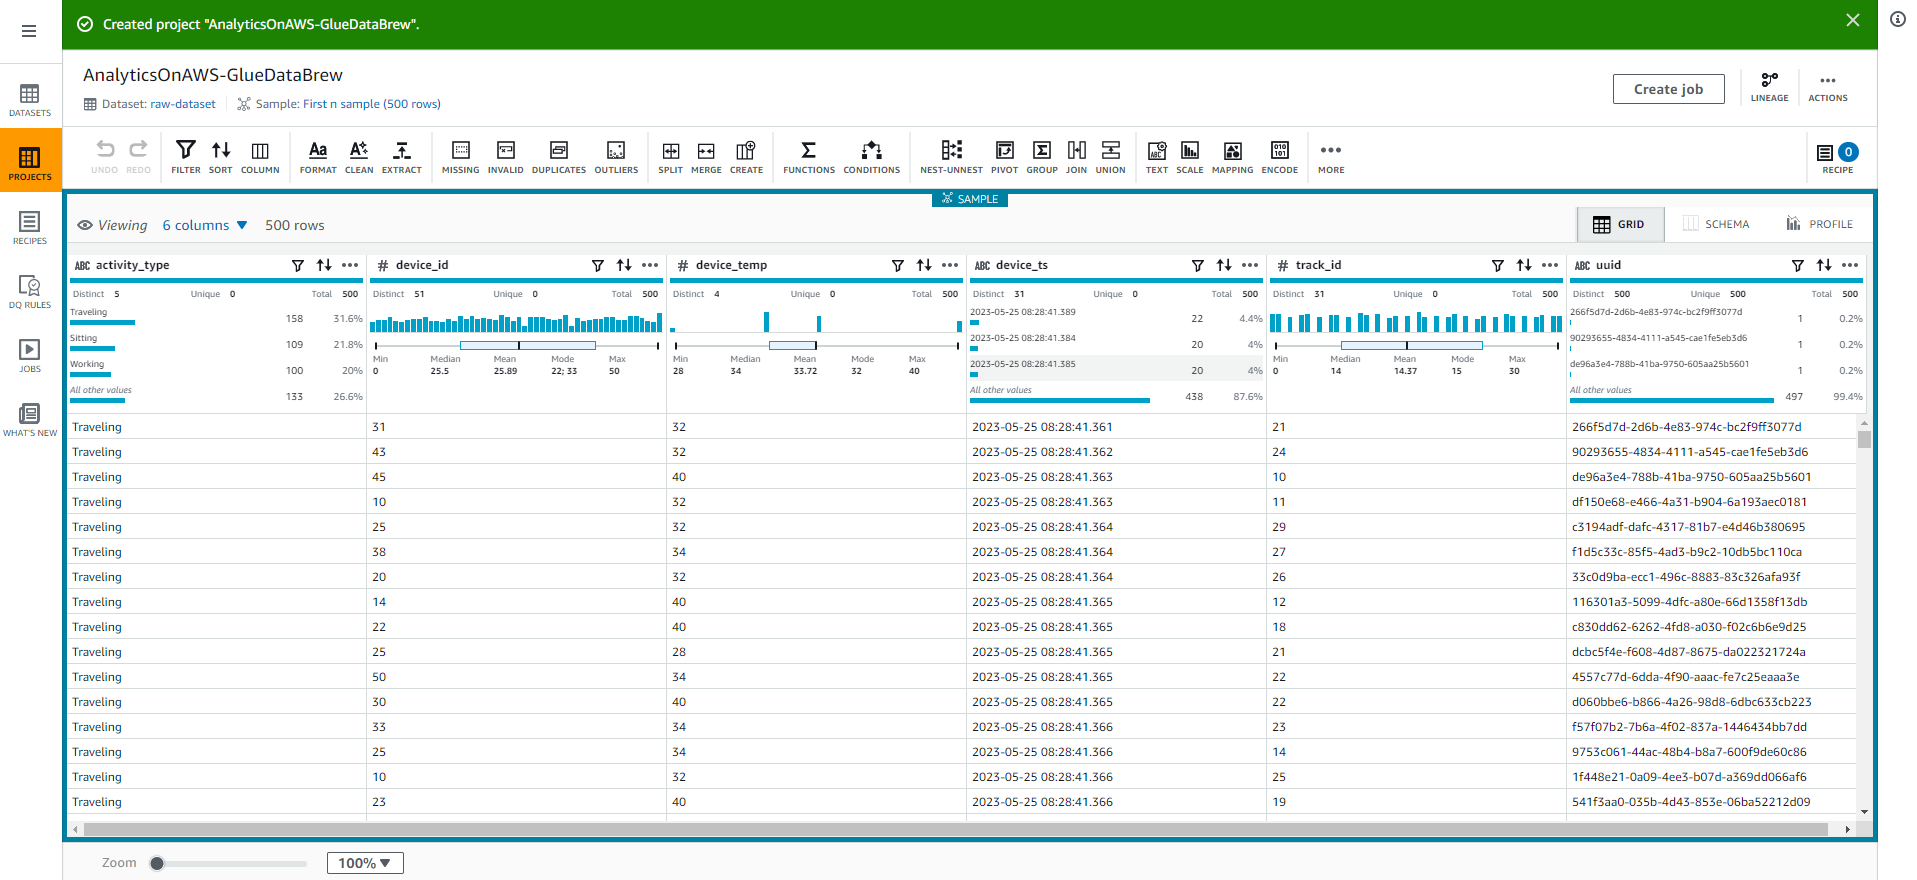
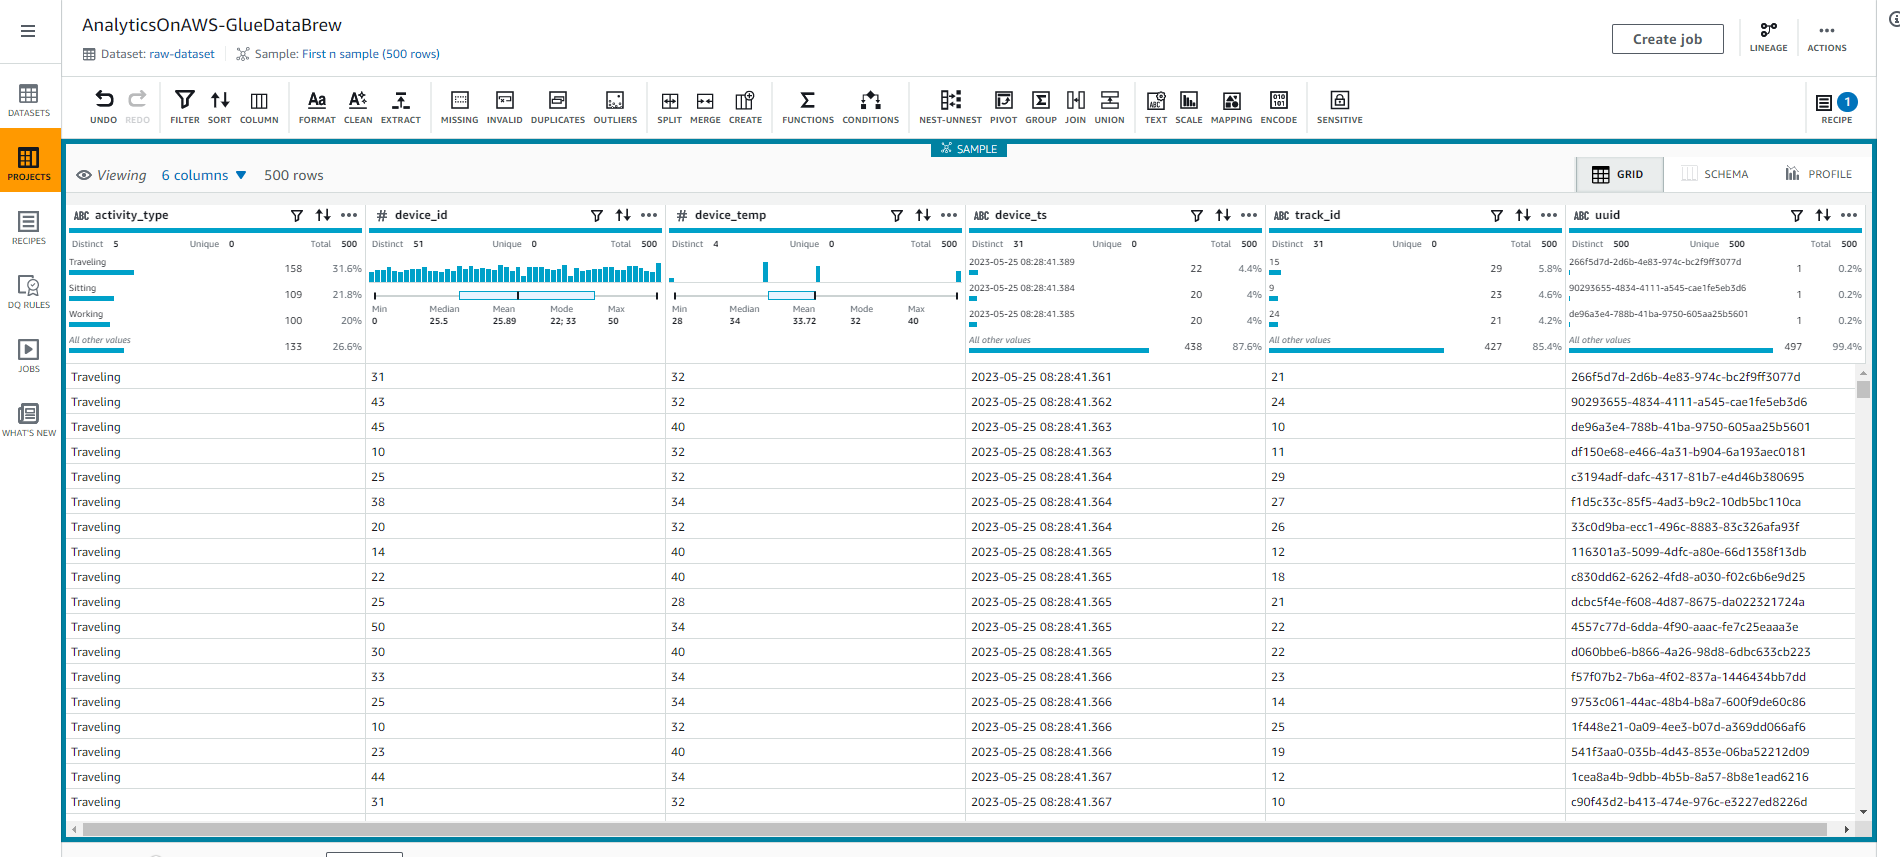
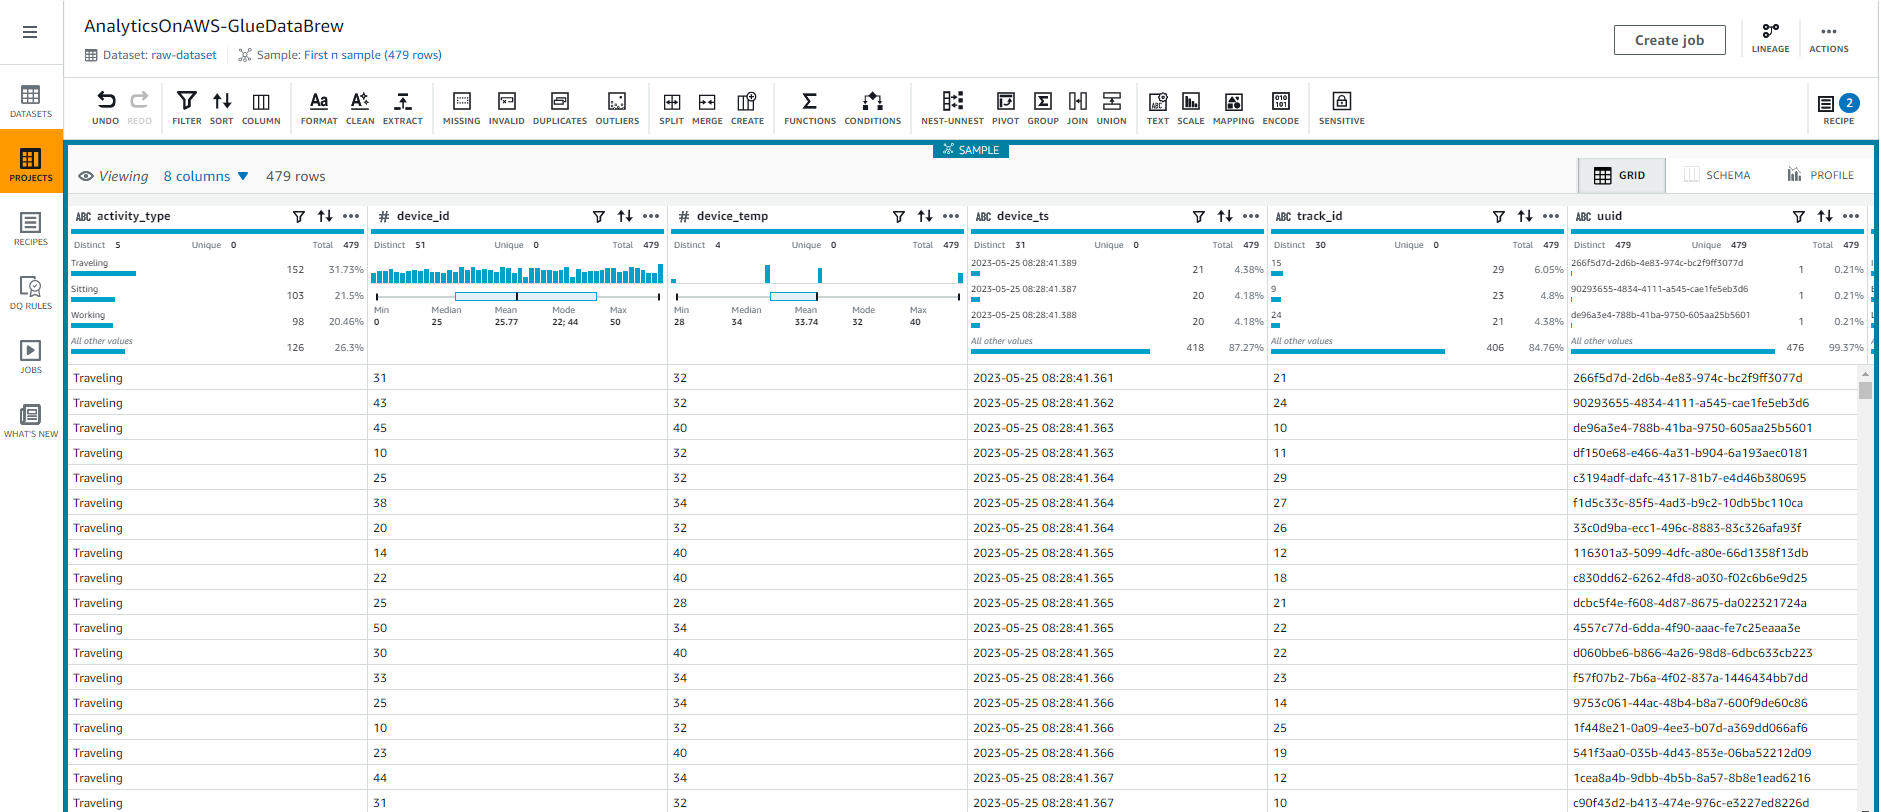
- Once the Glue DataBrew session has been created, you will see as shown in the screenshot below:
- Select the SCHEMA tab in the top right corner of the screen to explore the table’s schema and its properties such as column names, data types, data quality, value distribution, and a box chart for the values. value.
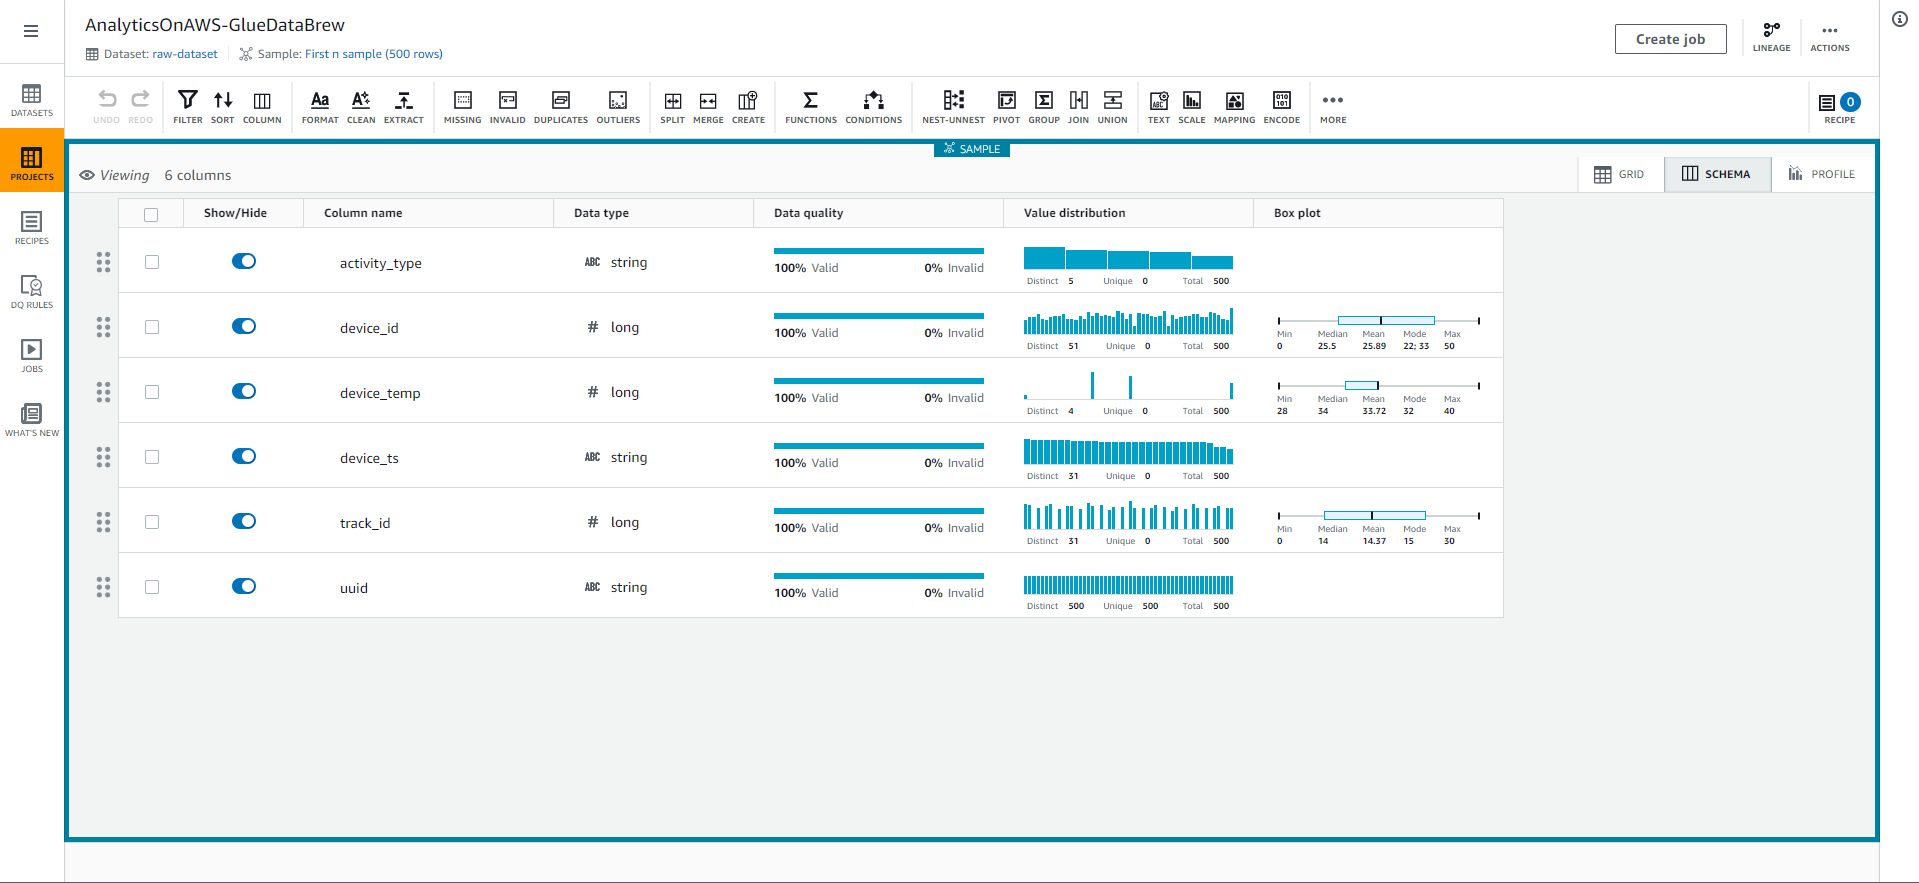
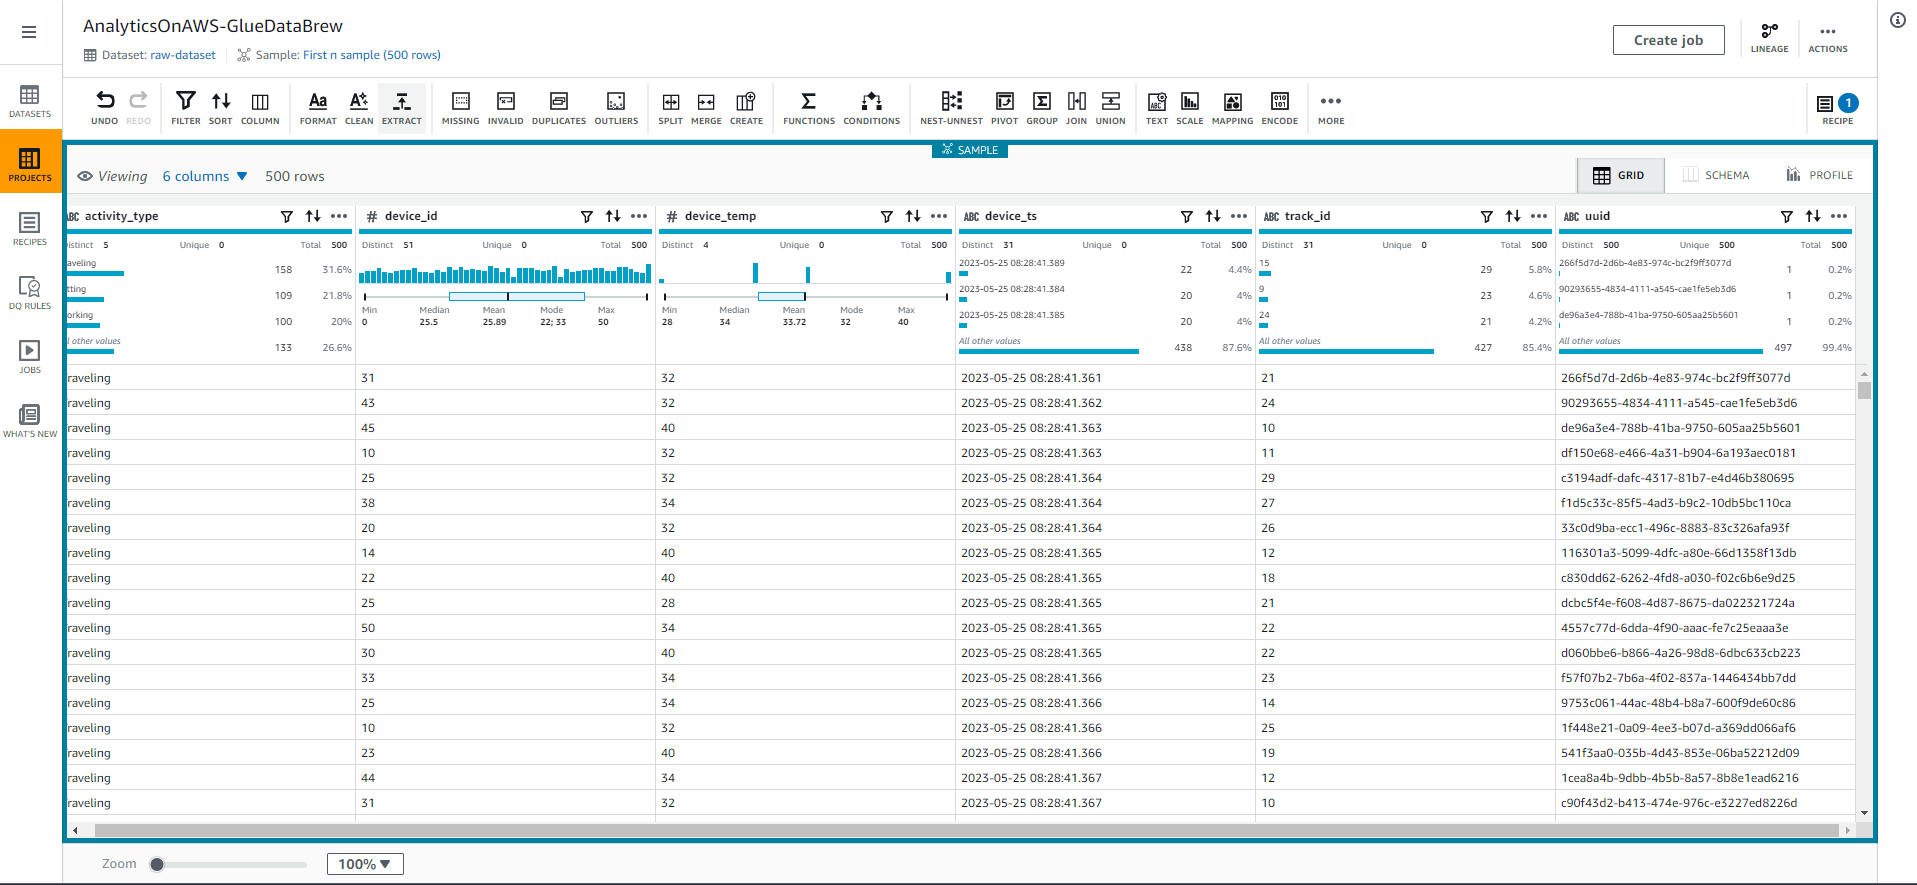
- Select the GRID tab to return to the grid view.
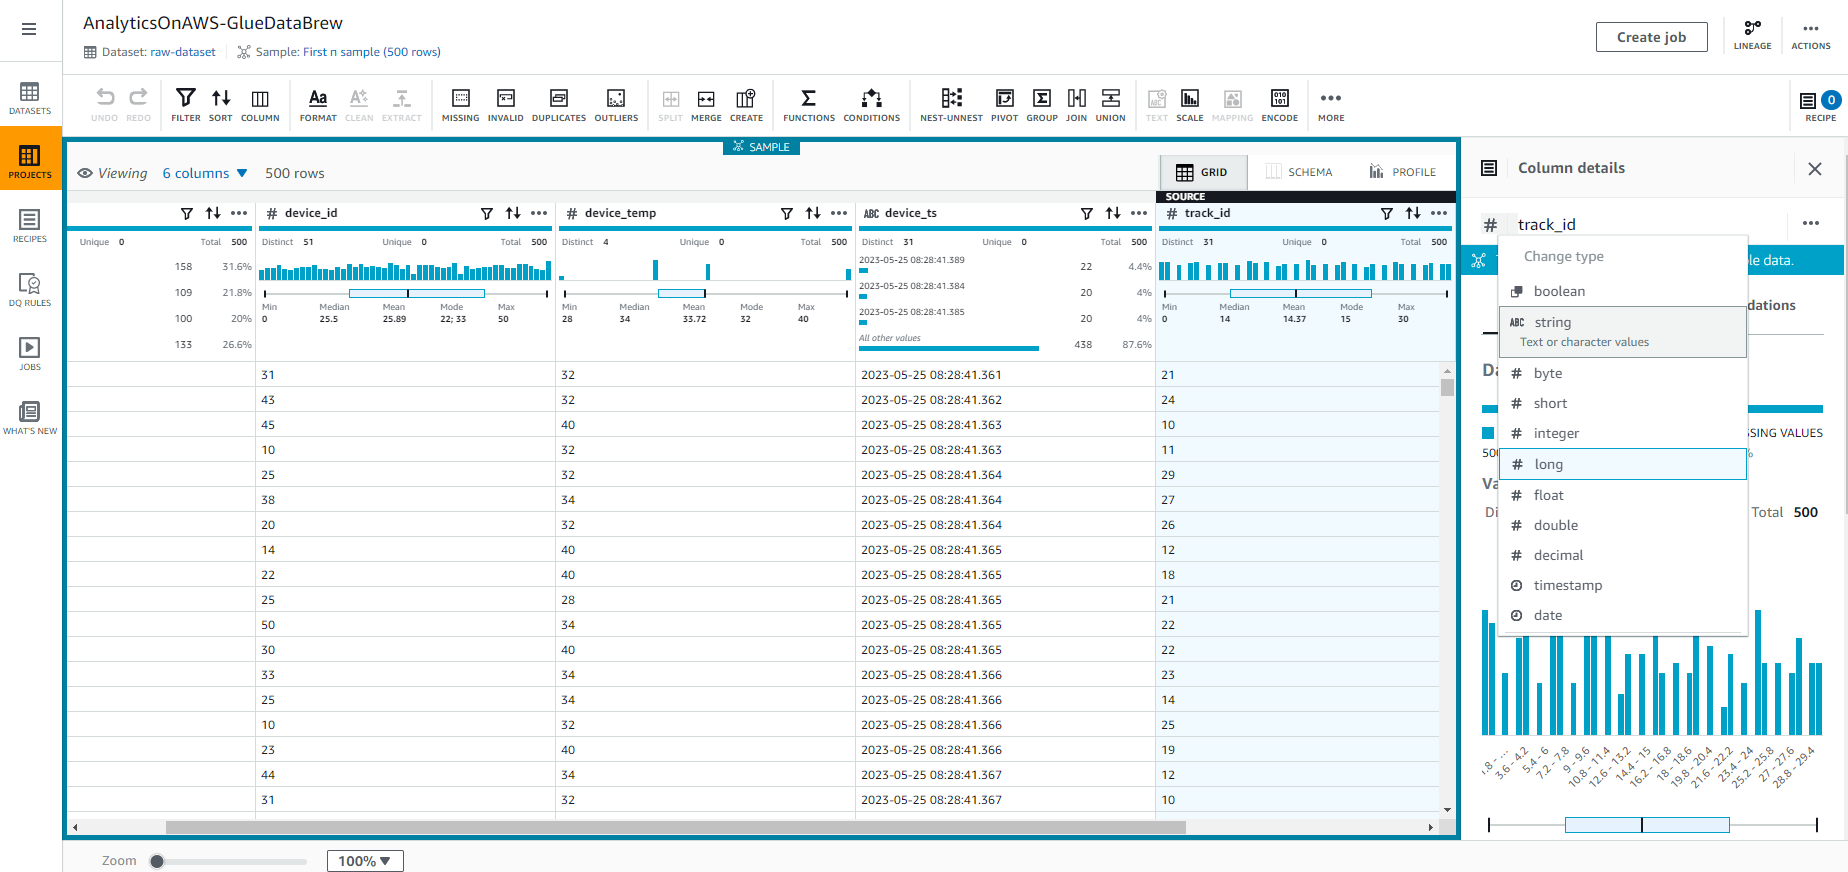
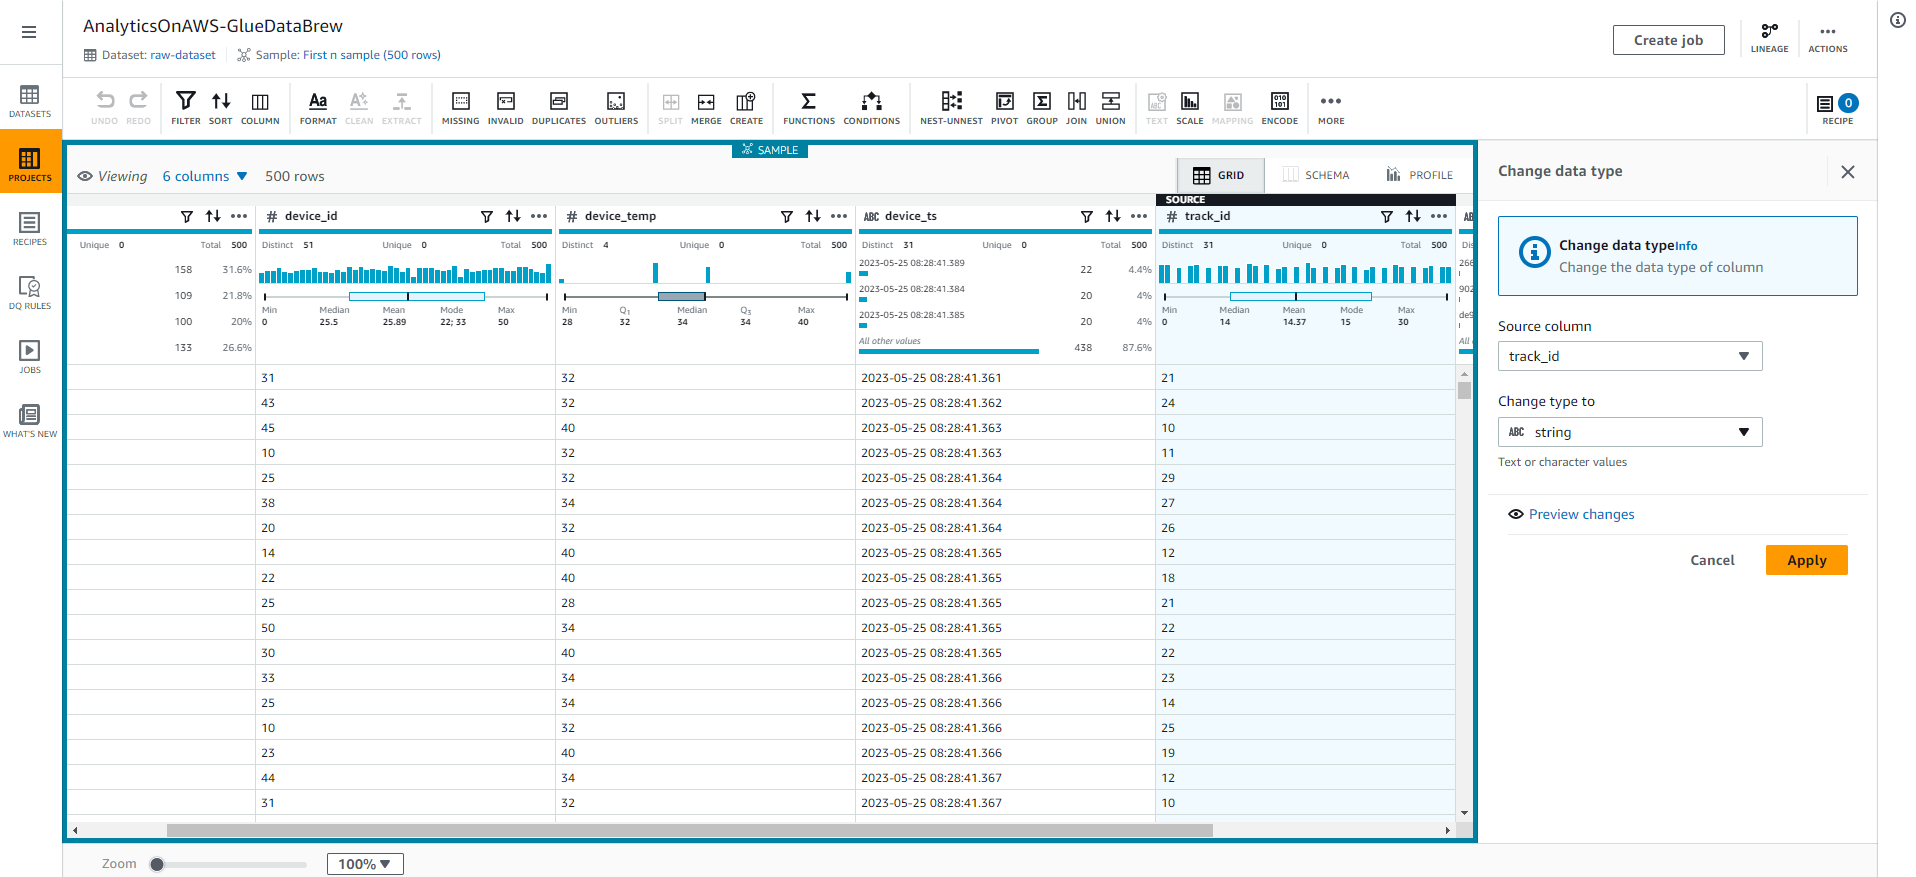
- We will change the track_id data type by selecting # in the track_id column, and select the string type as shown in the following screenshot.
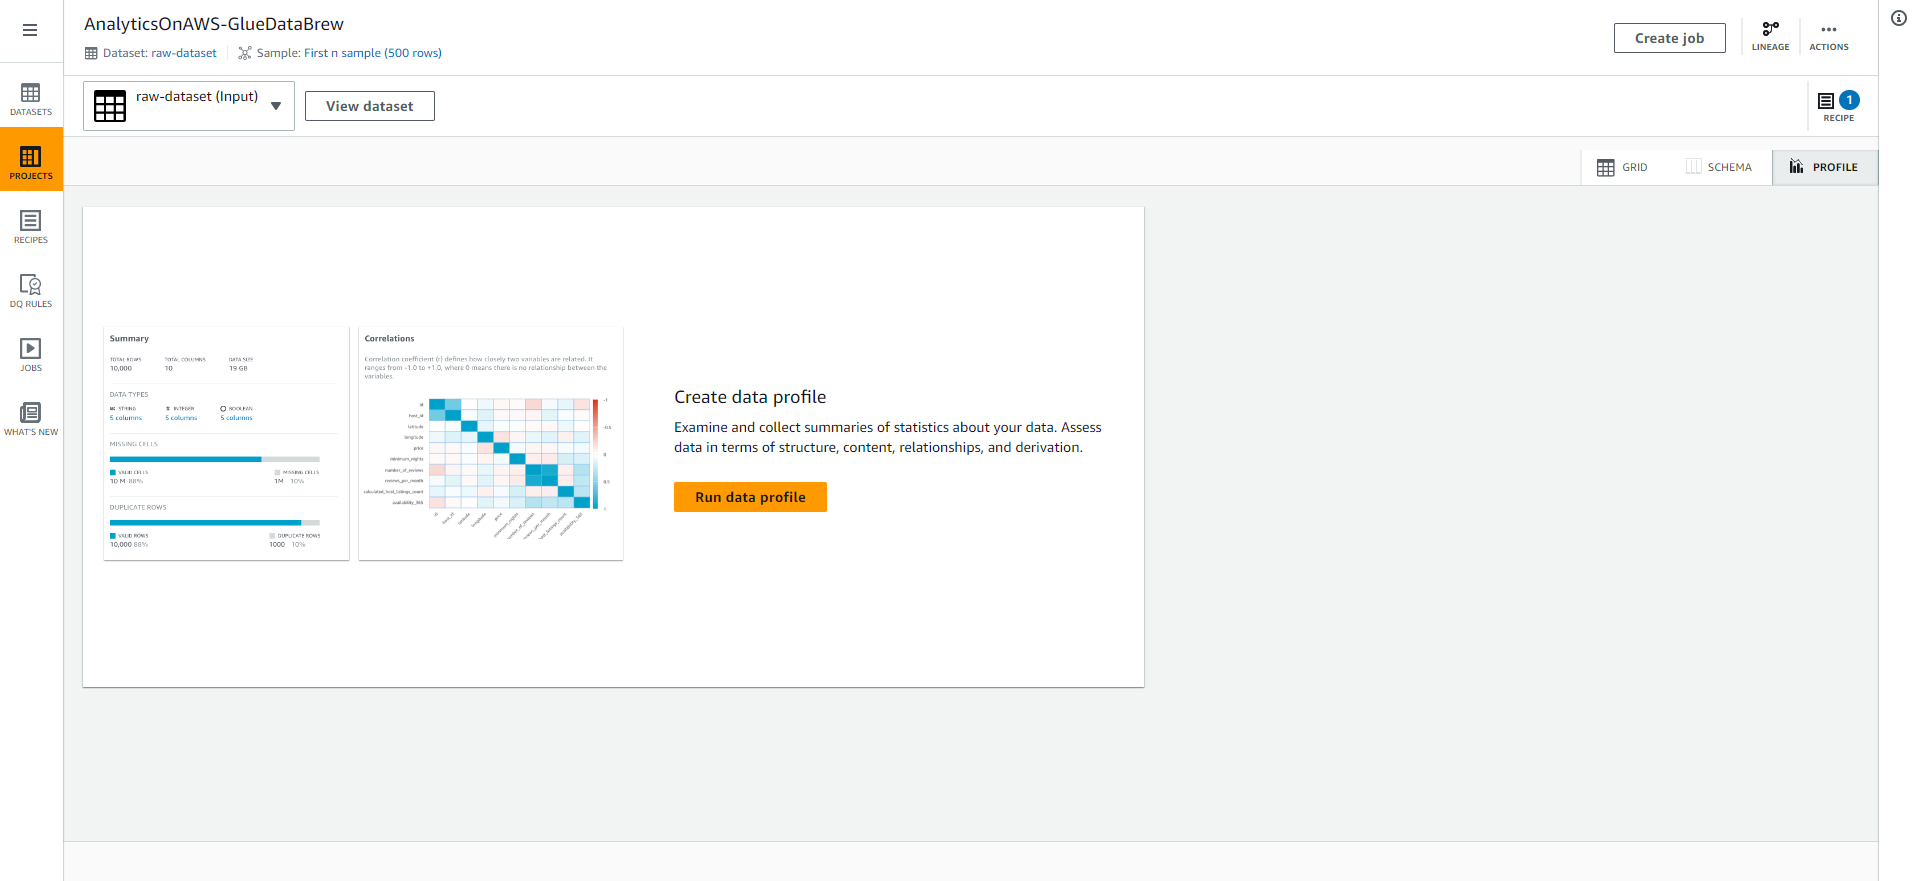
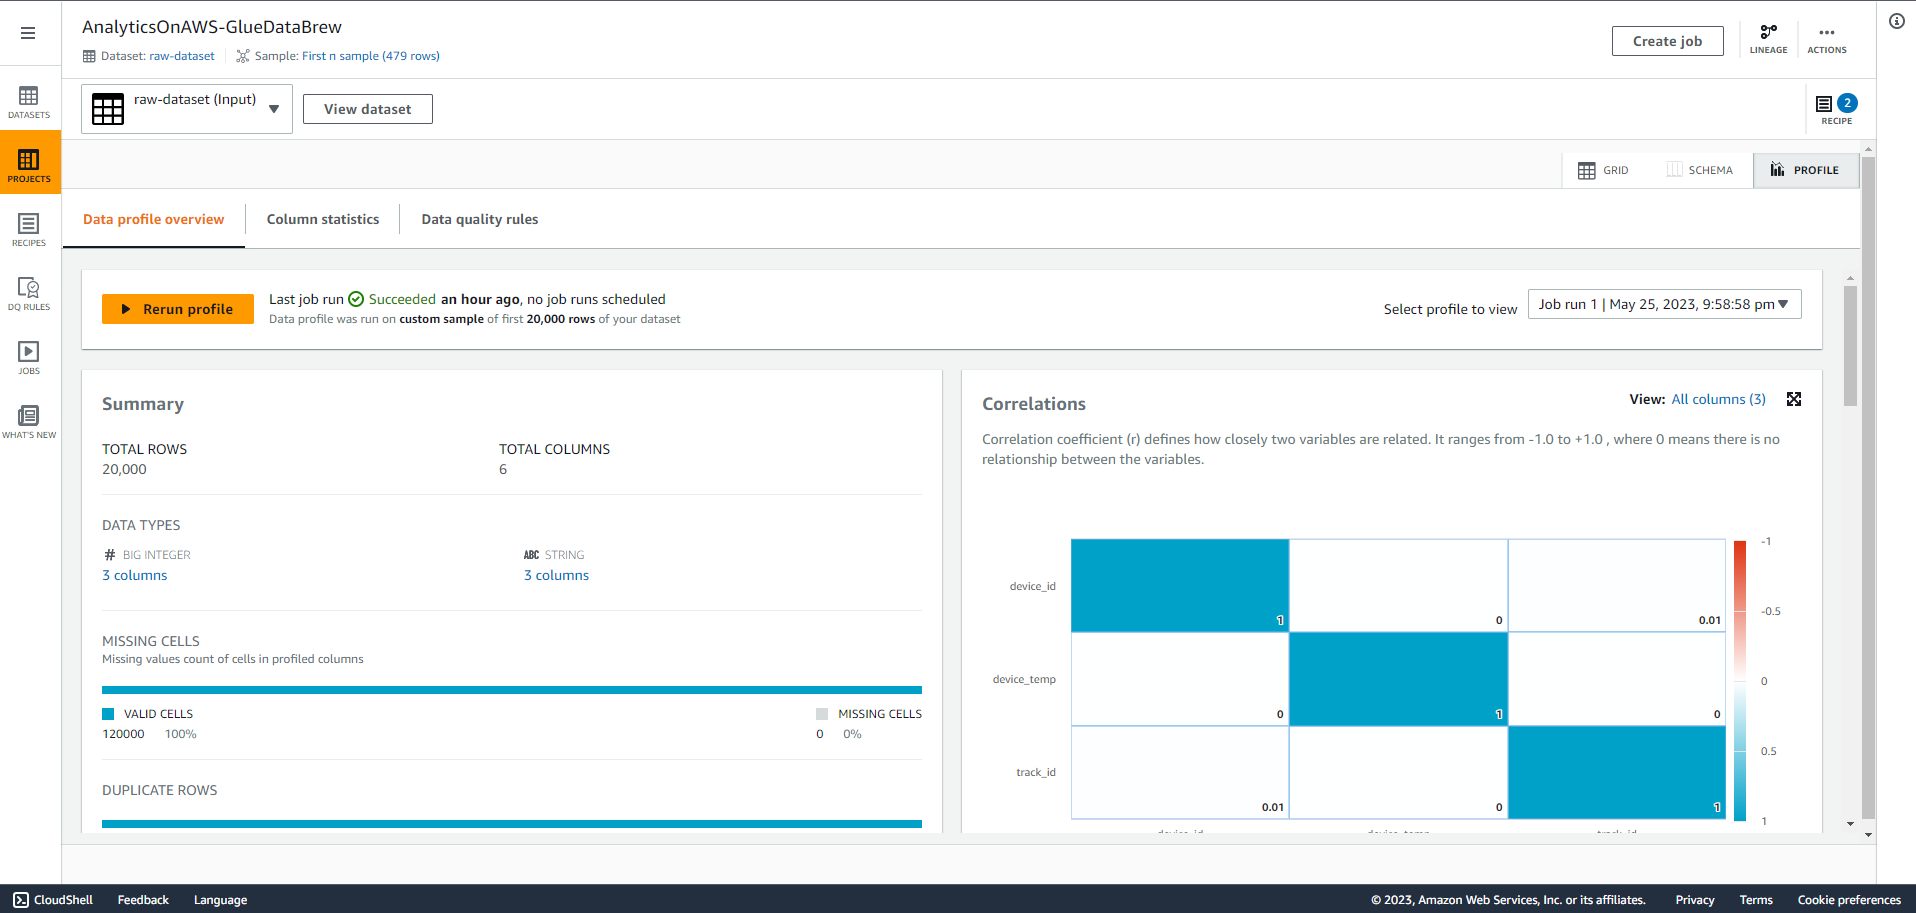
- Now, analyze the data to find out useful statistics such as correlations between attributes. Select the PROFILE tab in the top right corner of the screen, then Select Run data profile.
- Keep the Job name and Job run sample as default options.
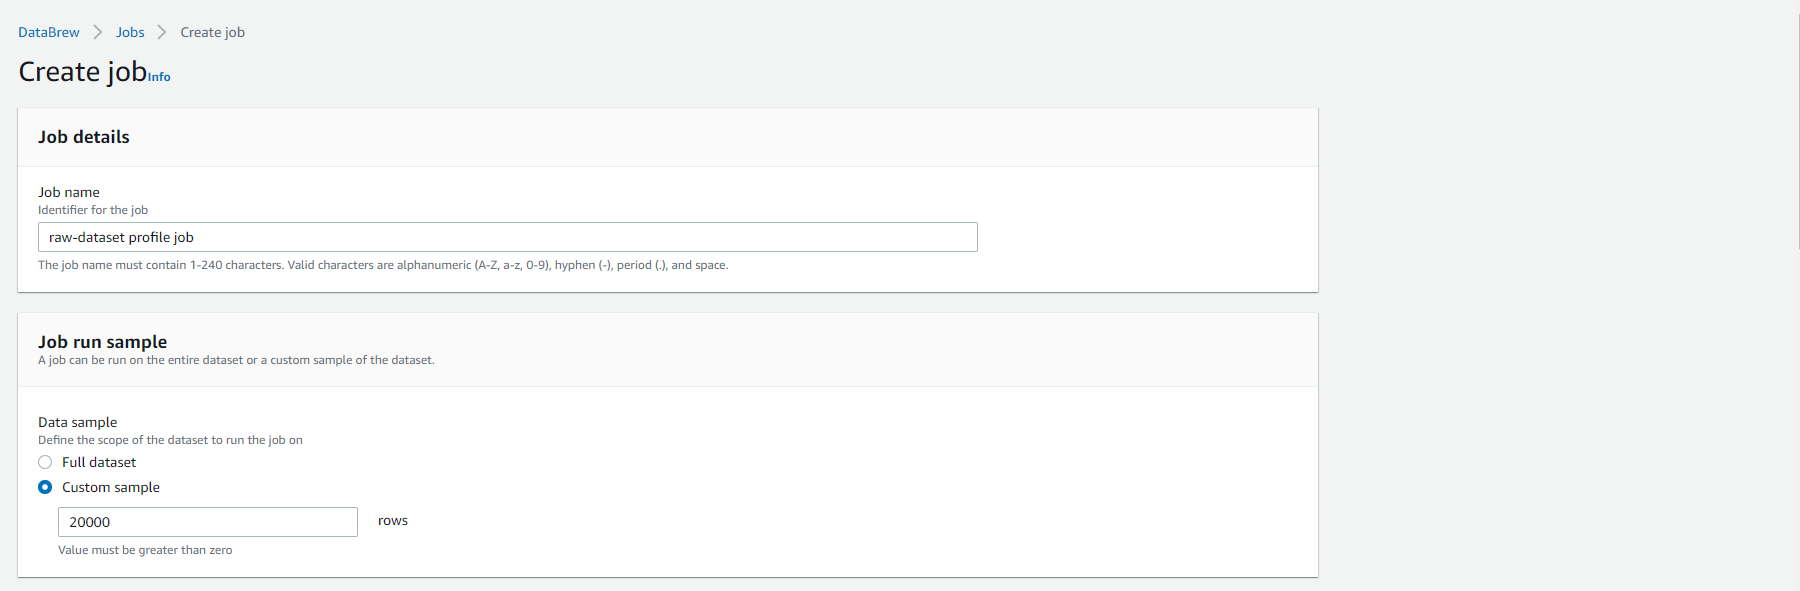
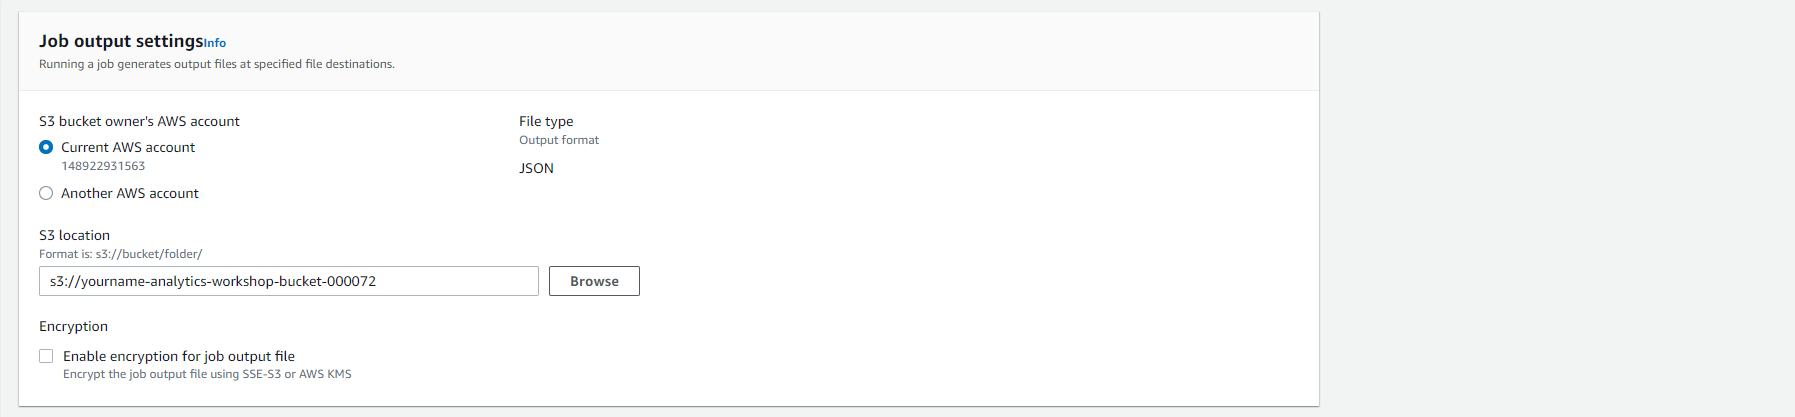
- Specify the S3 location as your bucket name: s3://-analytics-workshop-bucket/ to save the job results. Don’t forget to replace the part in the S3 path. Leave the option Open Encrypted for the job result file unchecked.
- Under Permissions, select the Role name created
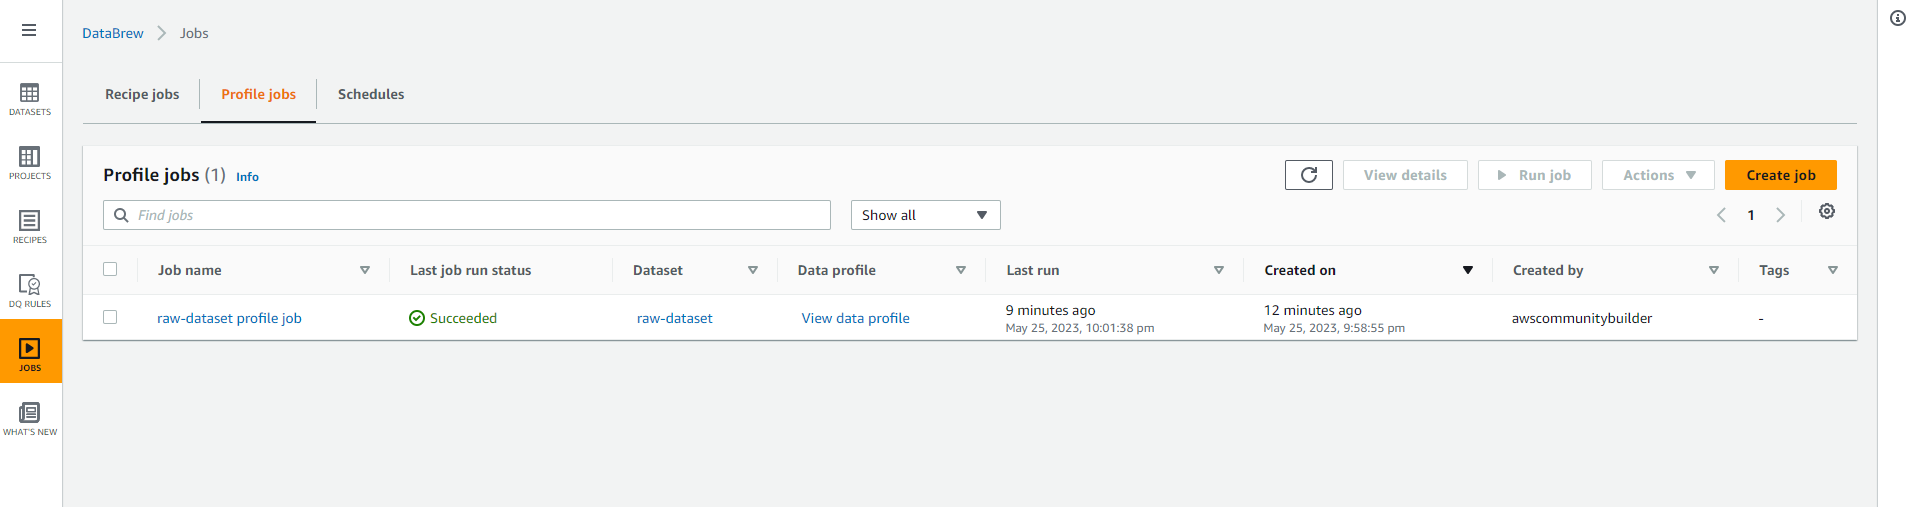
- Select Create and run job
- You should get a result similar to the image shown below, that means Glue Databrew has started analyzing your data.
- Select the GRID tab to return to the grid view.
- Select Join.
- Click Connect new dataset
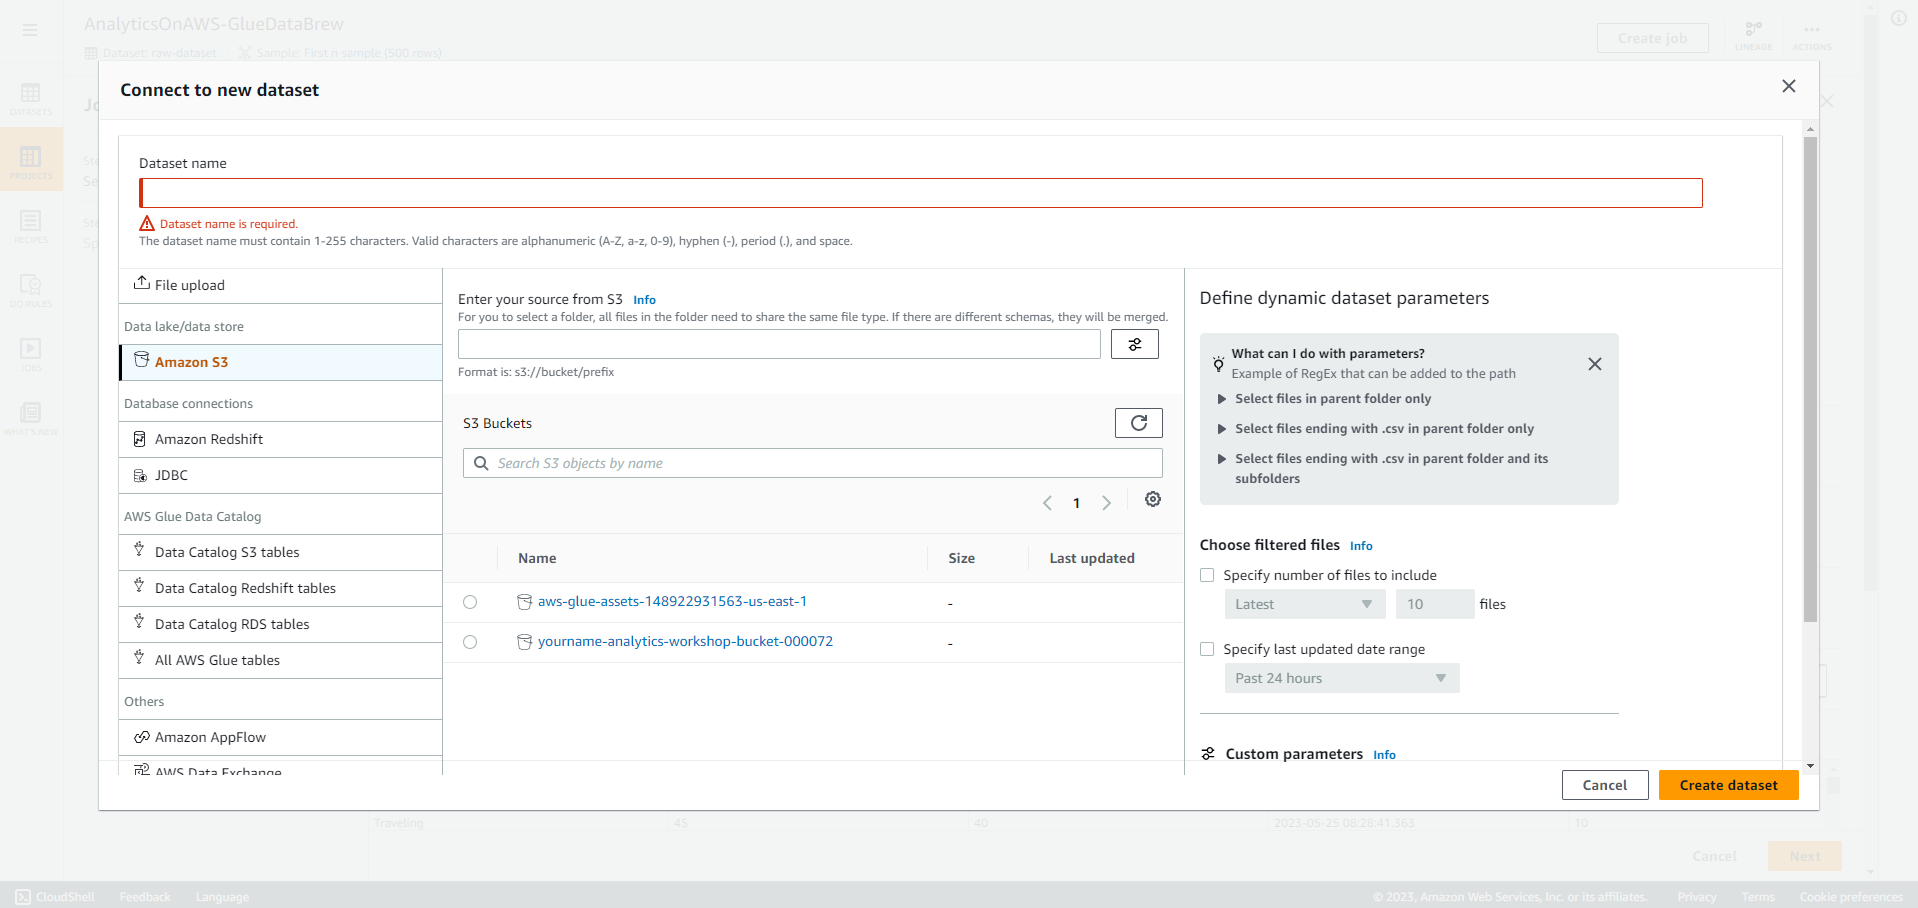
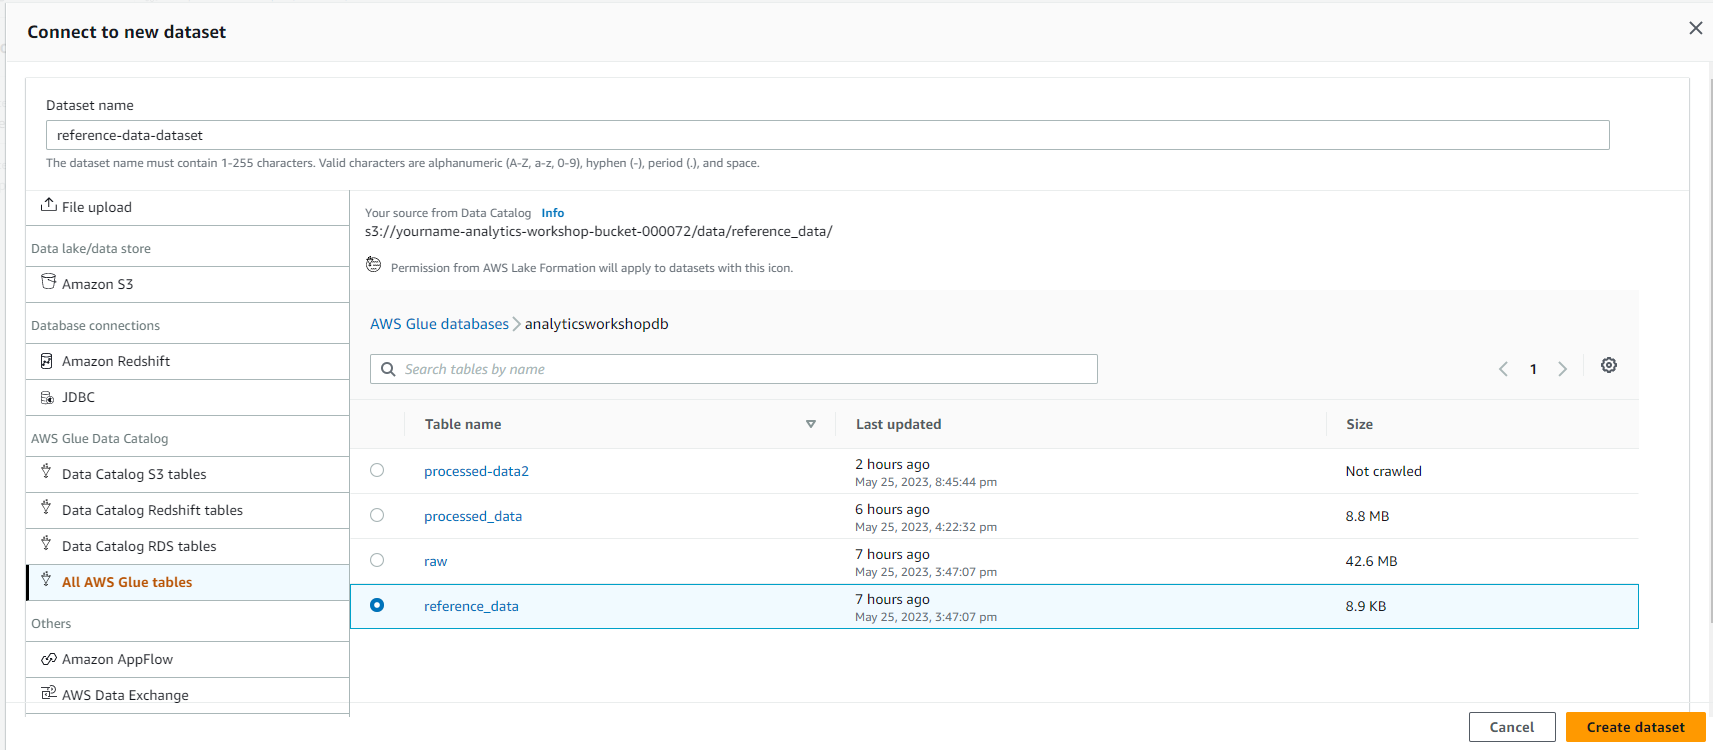
- Click All AWS Glue tables, and click analyticsworkshopdb
-
Click reference_data
-
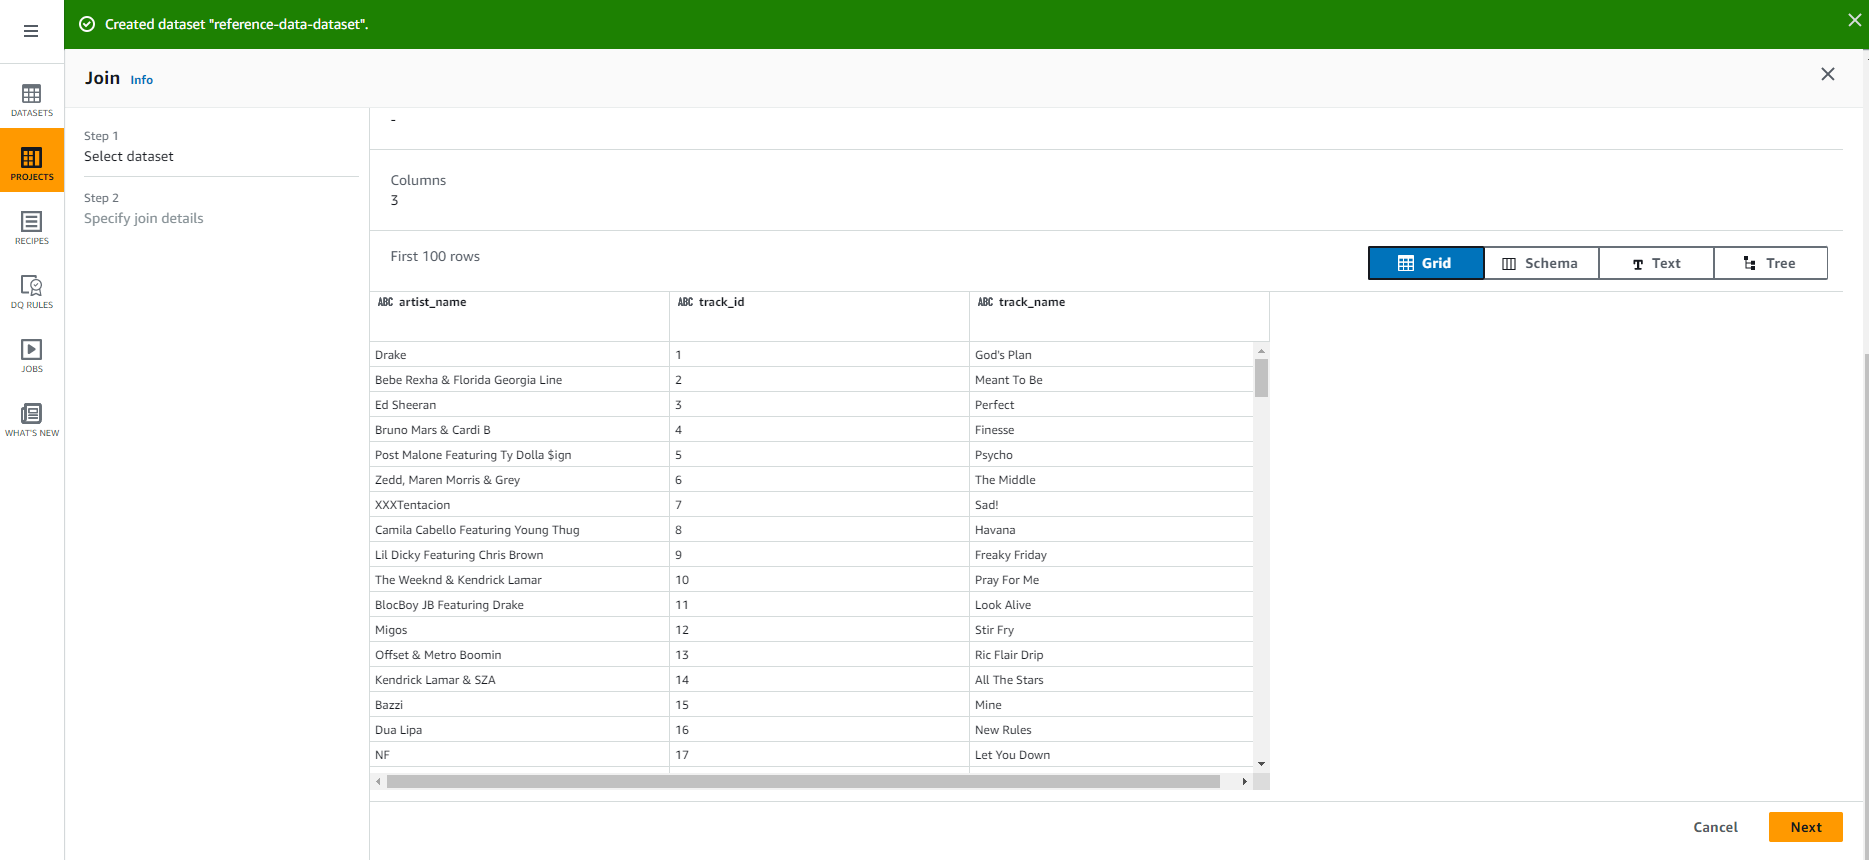
Dataset name - reference-data-dataset
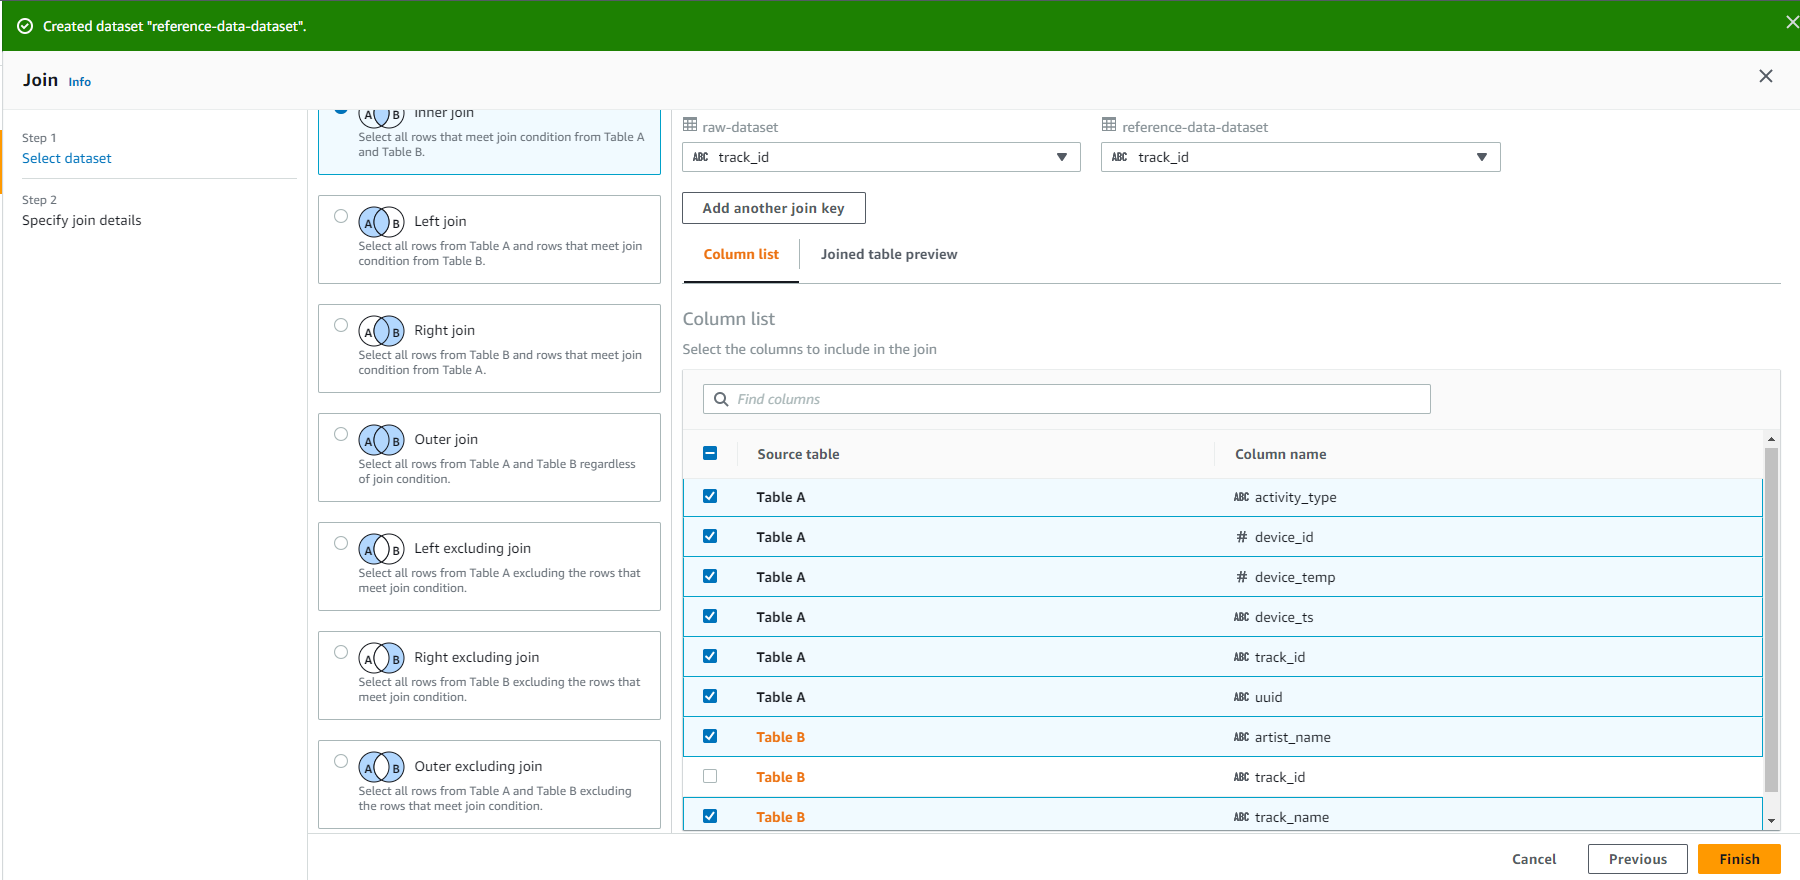
- You should see a screen similar to the image below, Click Next.
- Select track_id from raw-dataset
-
Select track_id from reference-data-set
-
Uncheck track_id from Table REMOVE
-
Select Finish
- You should see the results as shown in the screenshot below:
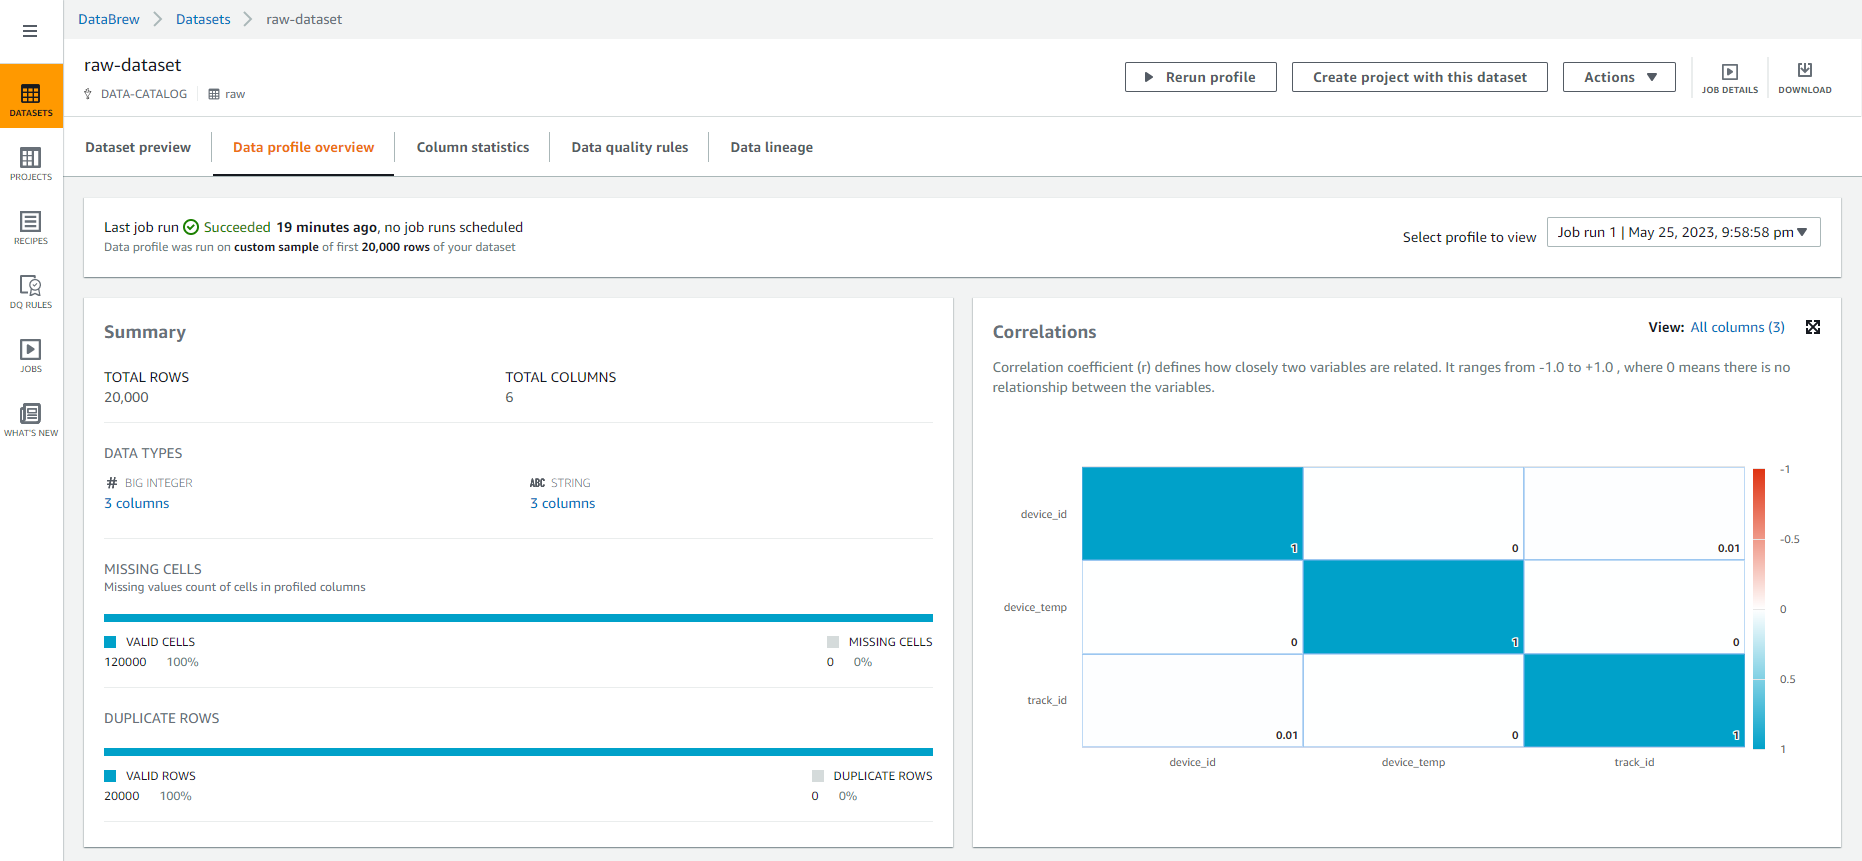
- Select “PROFILE” to see the results of your original data analysis such as overview, blanks, duplicate rows, correlation, value distribution and column statistics. This will give you a closer look at your data.
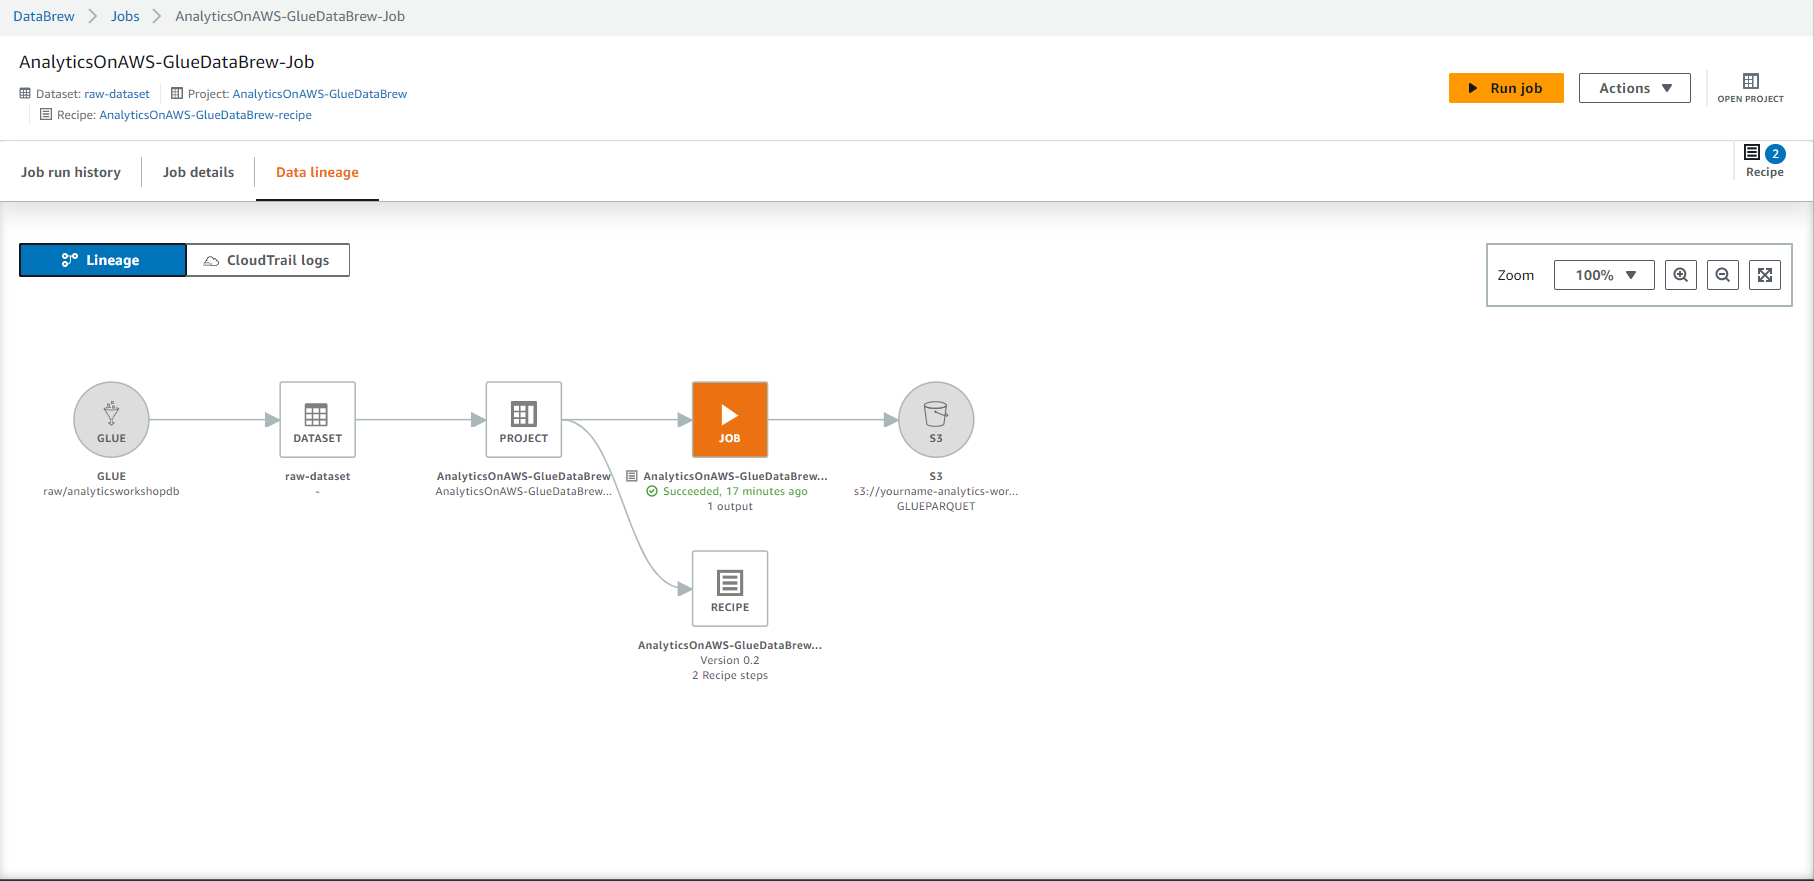
- Select LINEAGE in the top right corner. You should be able to see the data lineage, represented graphically to provide an understanding of the data flow with the transformations involved at all steps from source to destination.
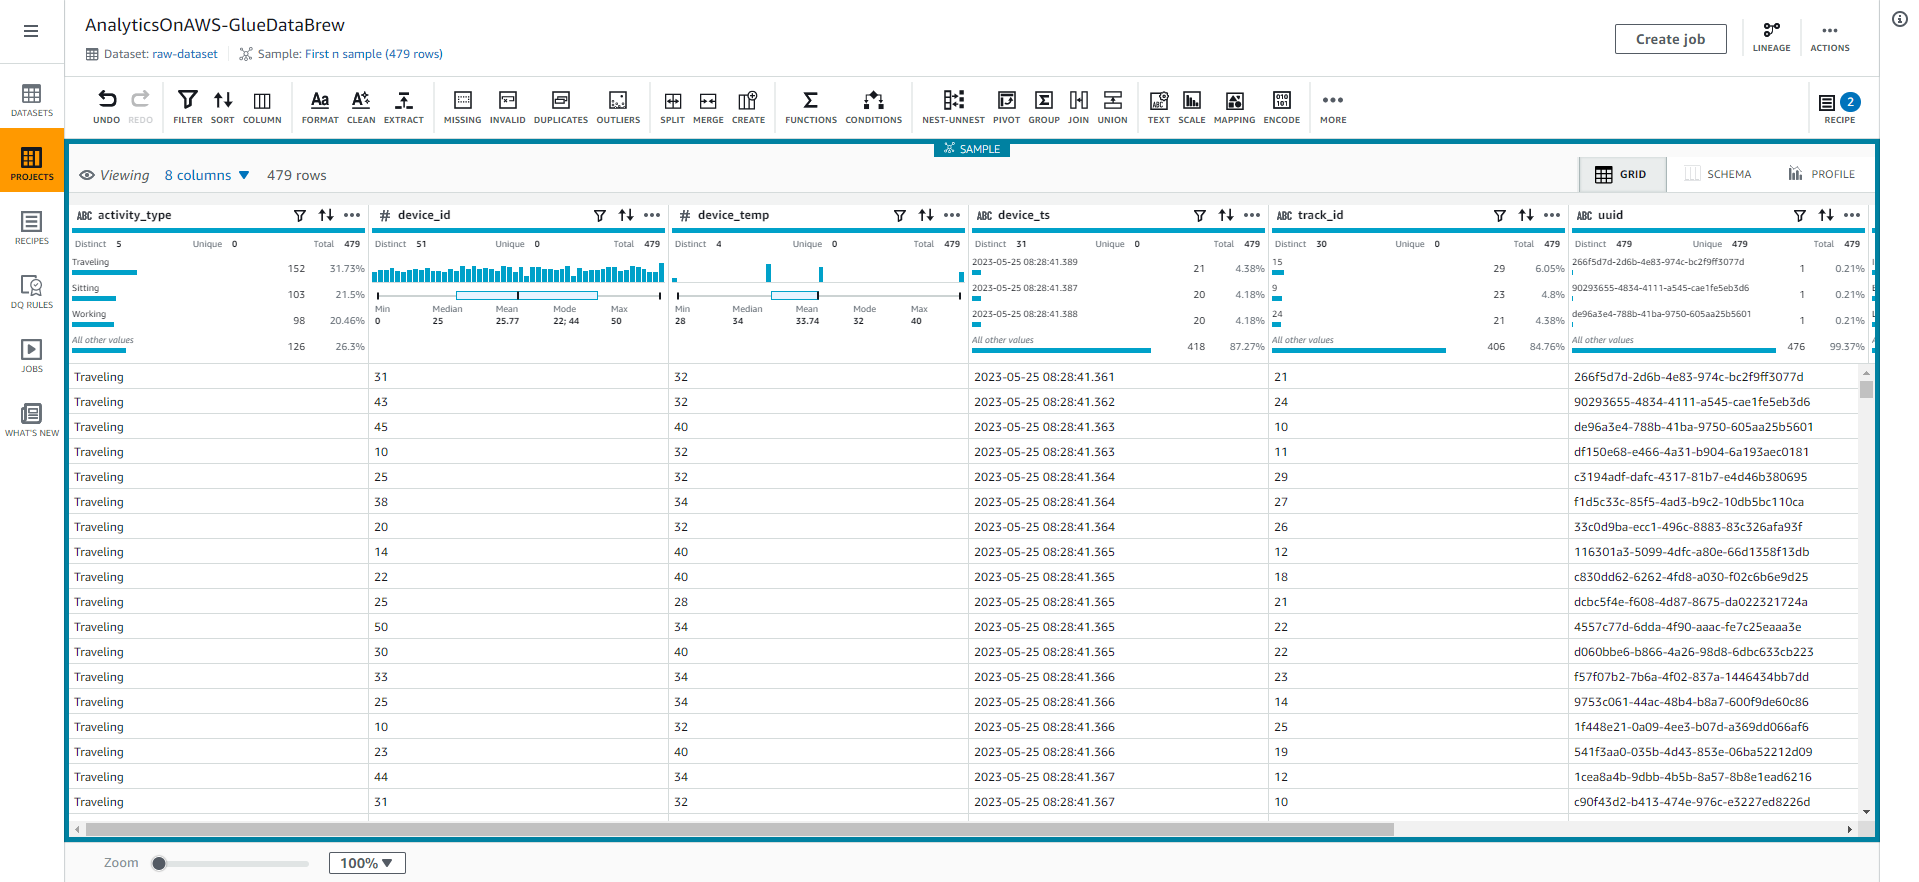
- Go back to GRID view, and Select Create job.
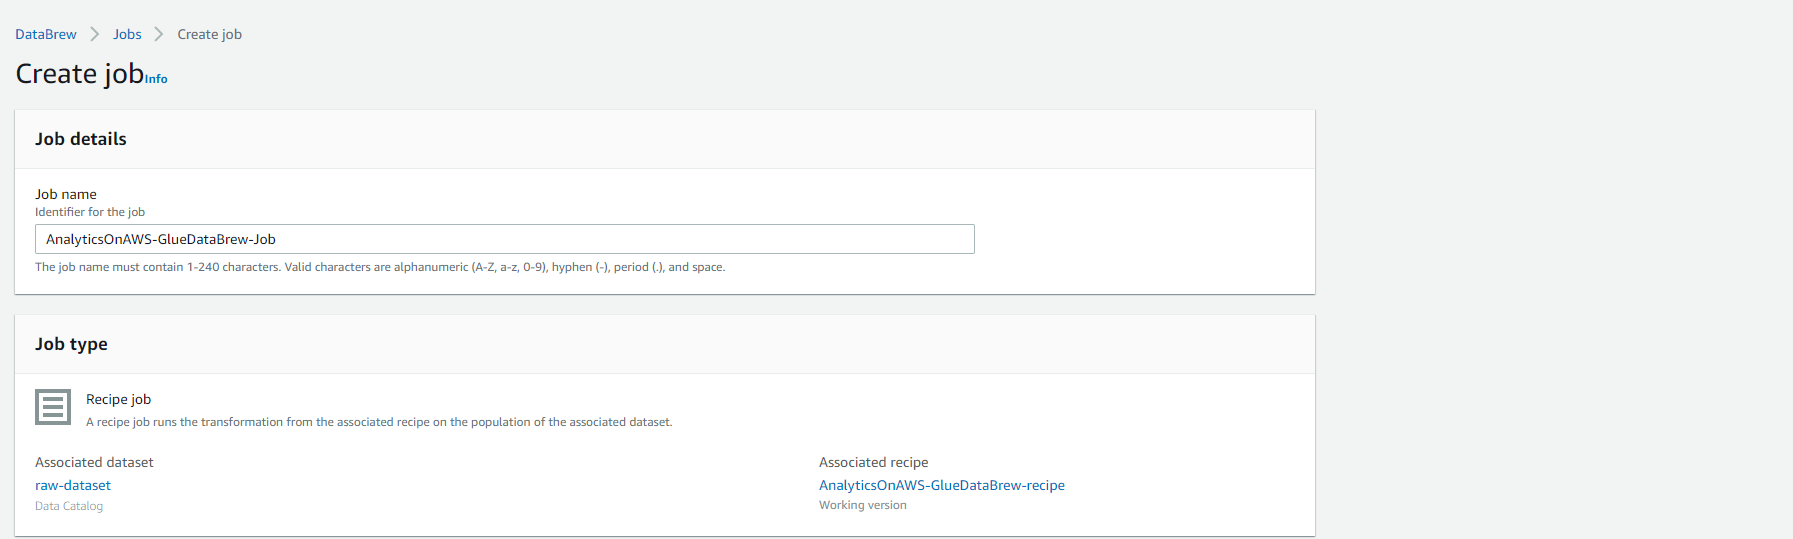
- Fill in the following values:
- Under Job details
- Job name: AnalyticsOnAWS-GlueDataBrew-Job
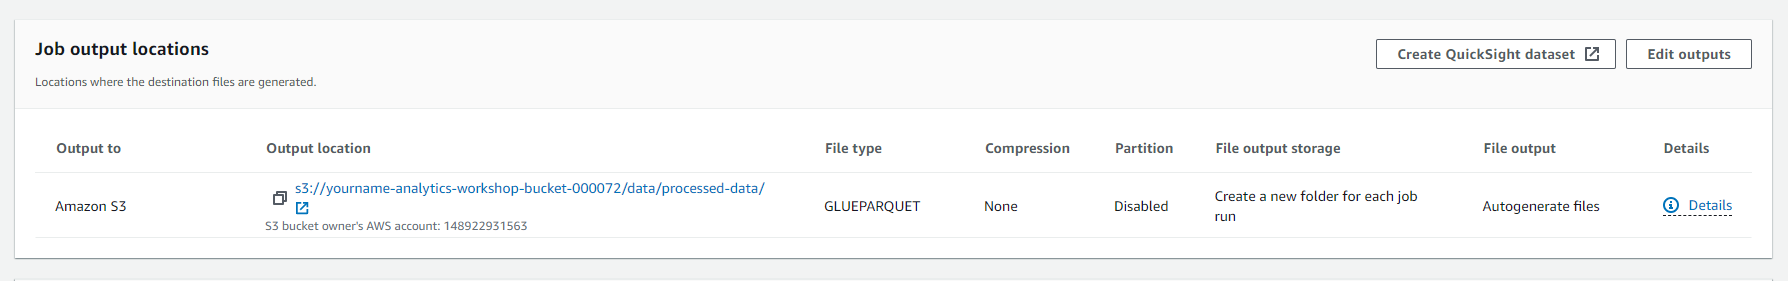
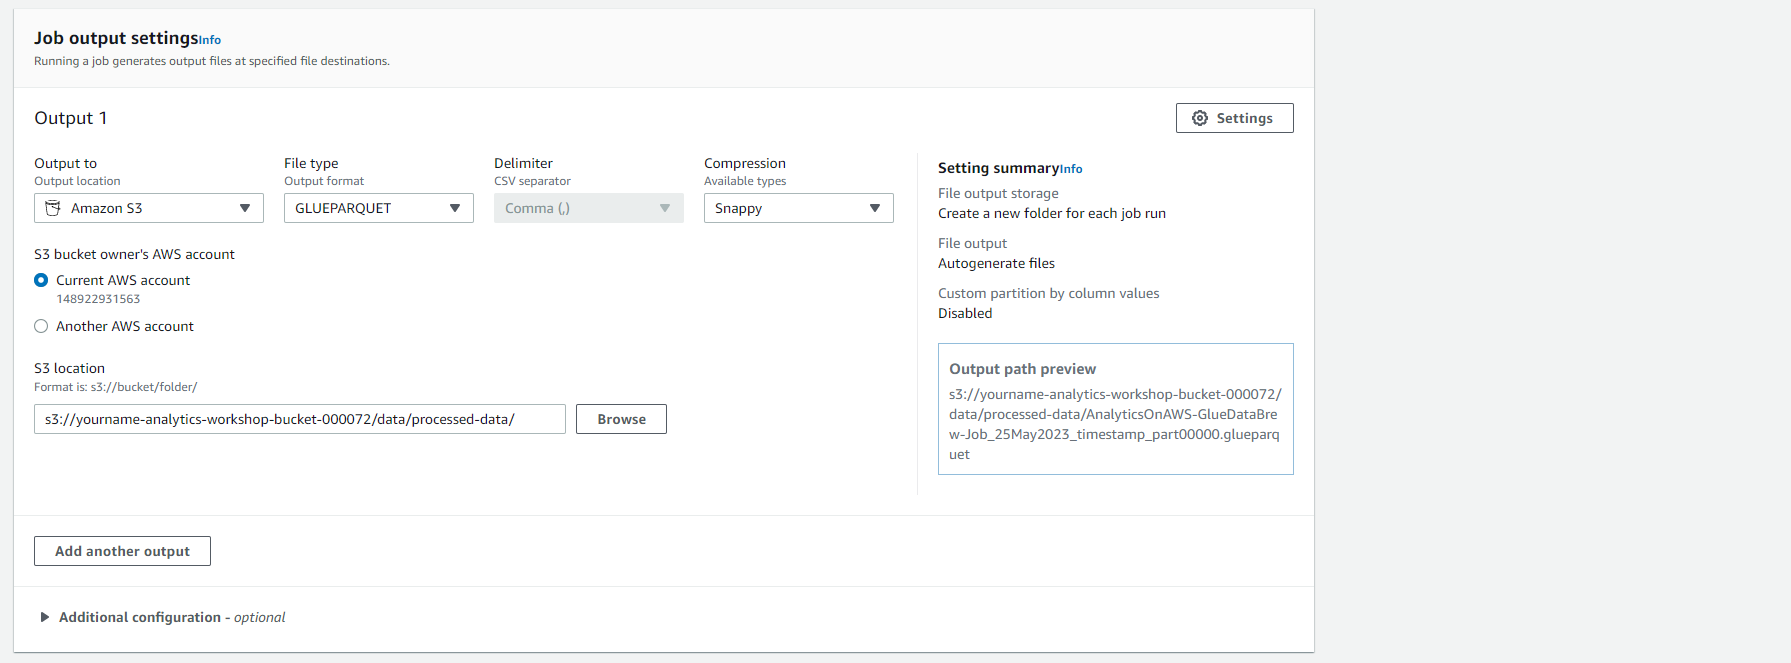
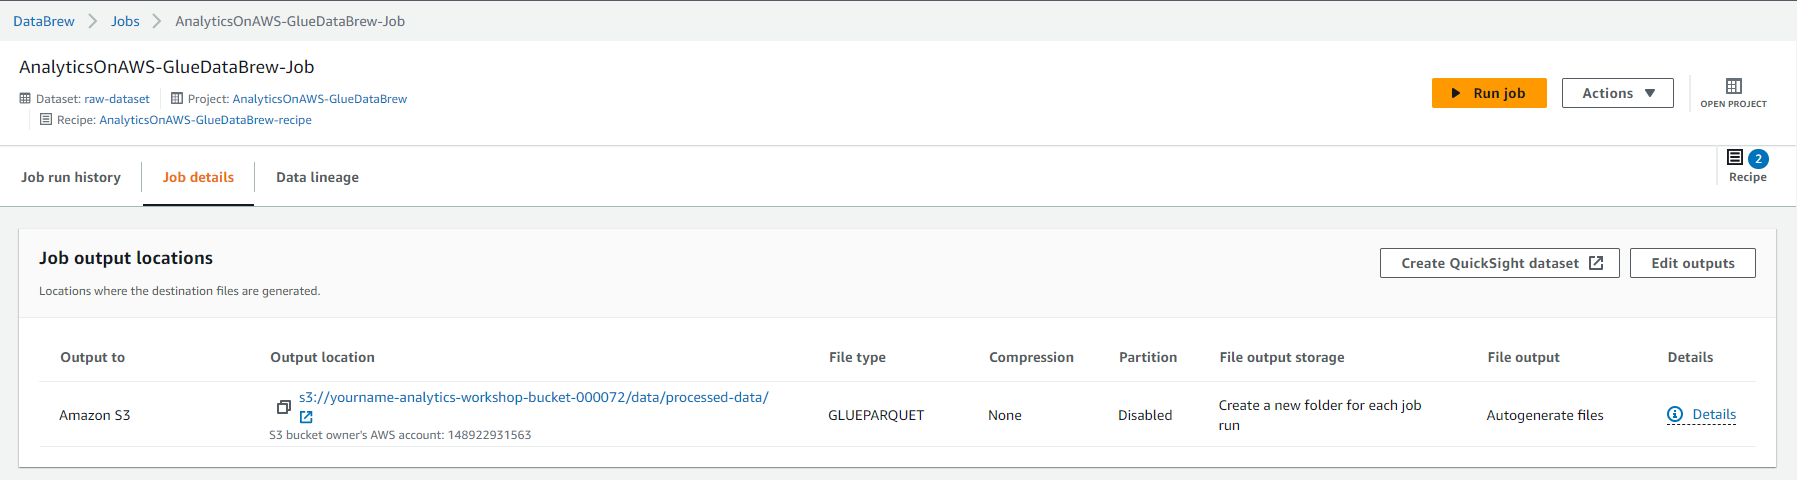
- Under Job output settings
- File type: GlueParquet
- S3 location: s3://-analytics-workshop-bucket/data/processed-data/
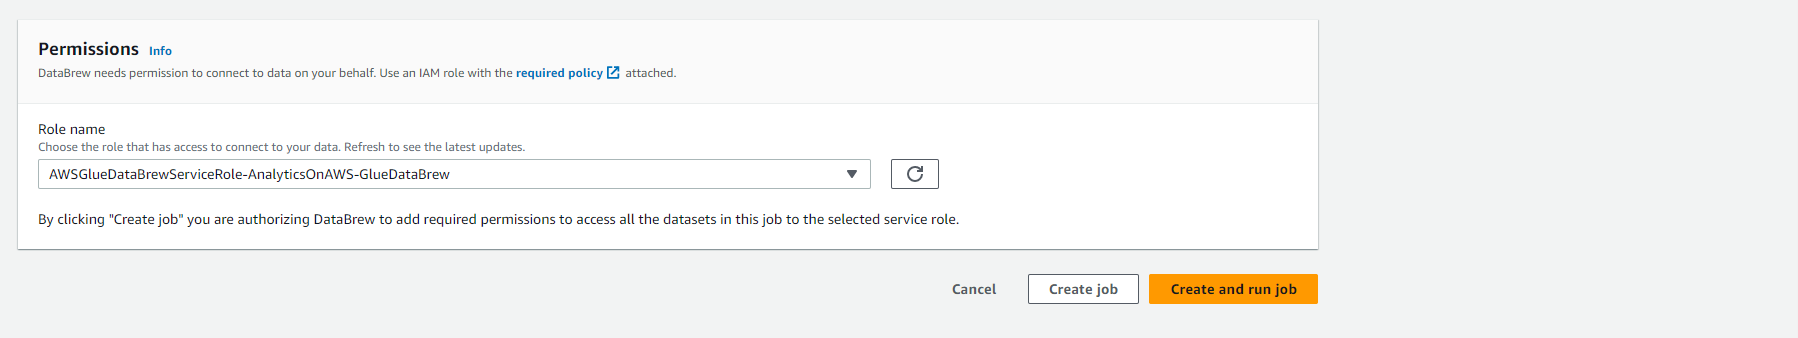
- Scroll down to the “Permission” section and select the role name you created in the first step, then Click on “Create and run job”.
- You should see a job in progress
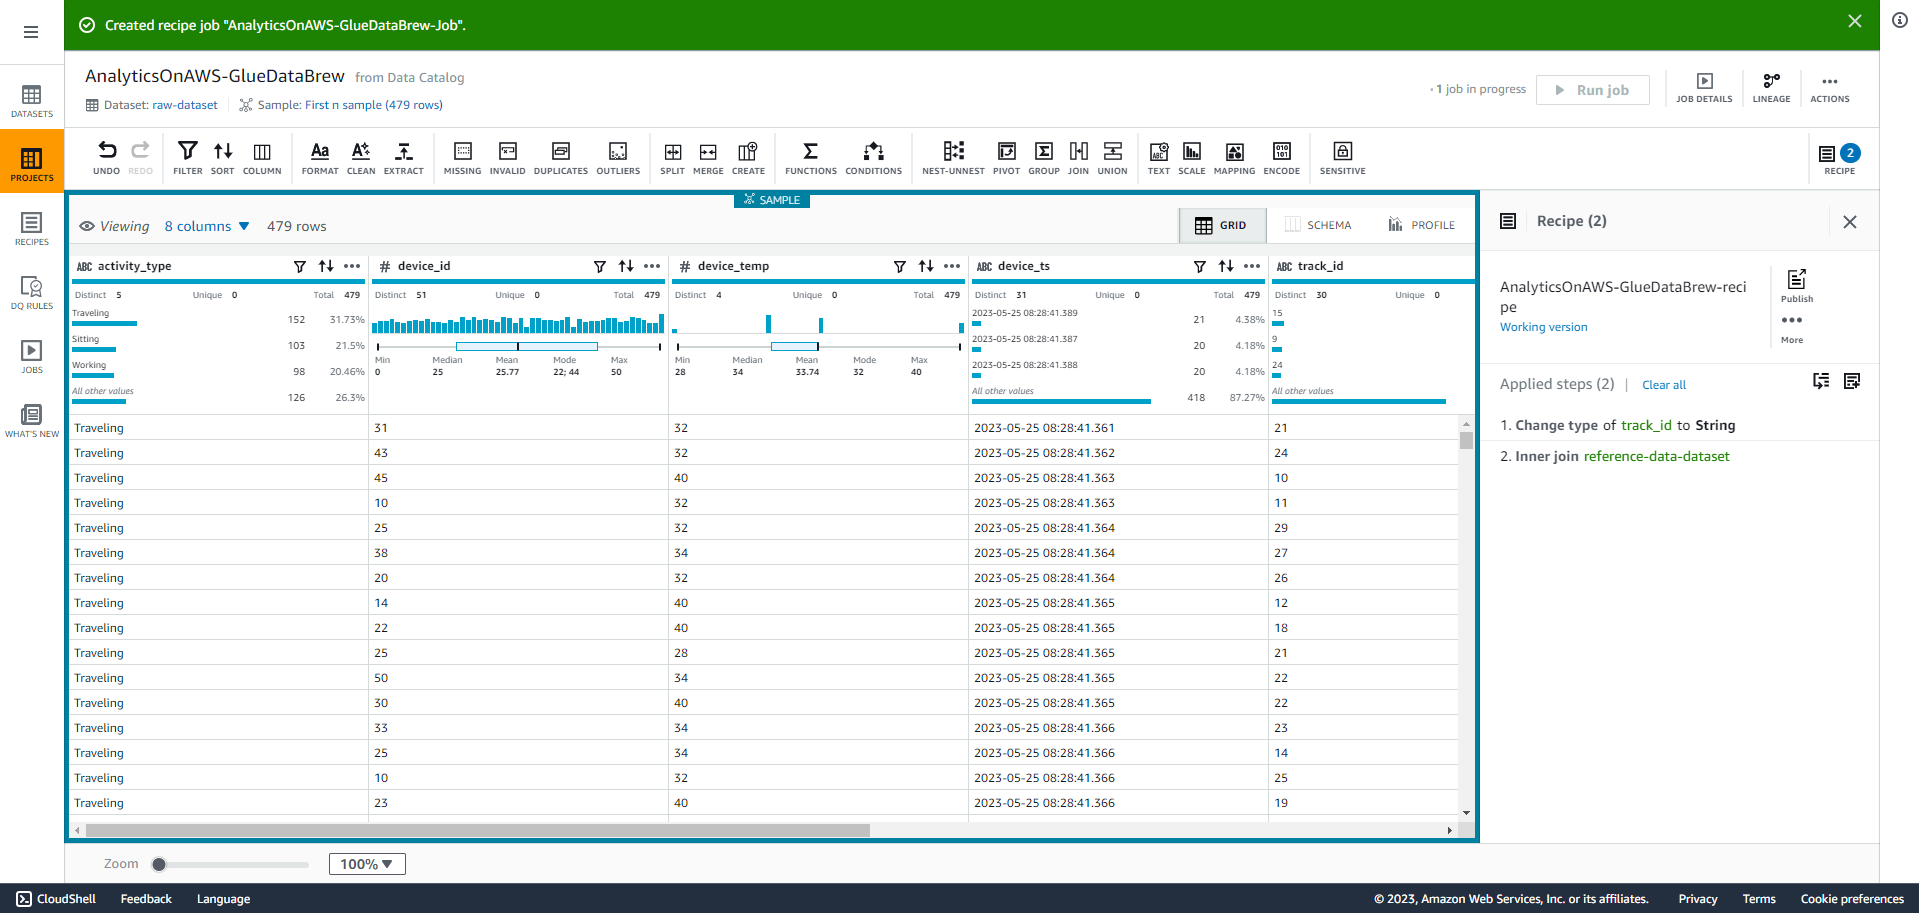
- Select “Jobs” on the left menu, you will see below screenshot, then Select Job name (link). Here, you can explore the job run history, job details and data flow like in the screenshot below:
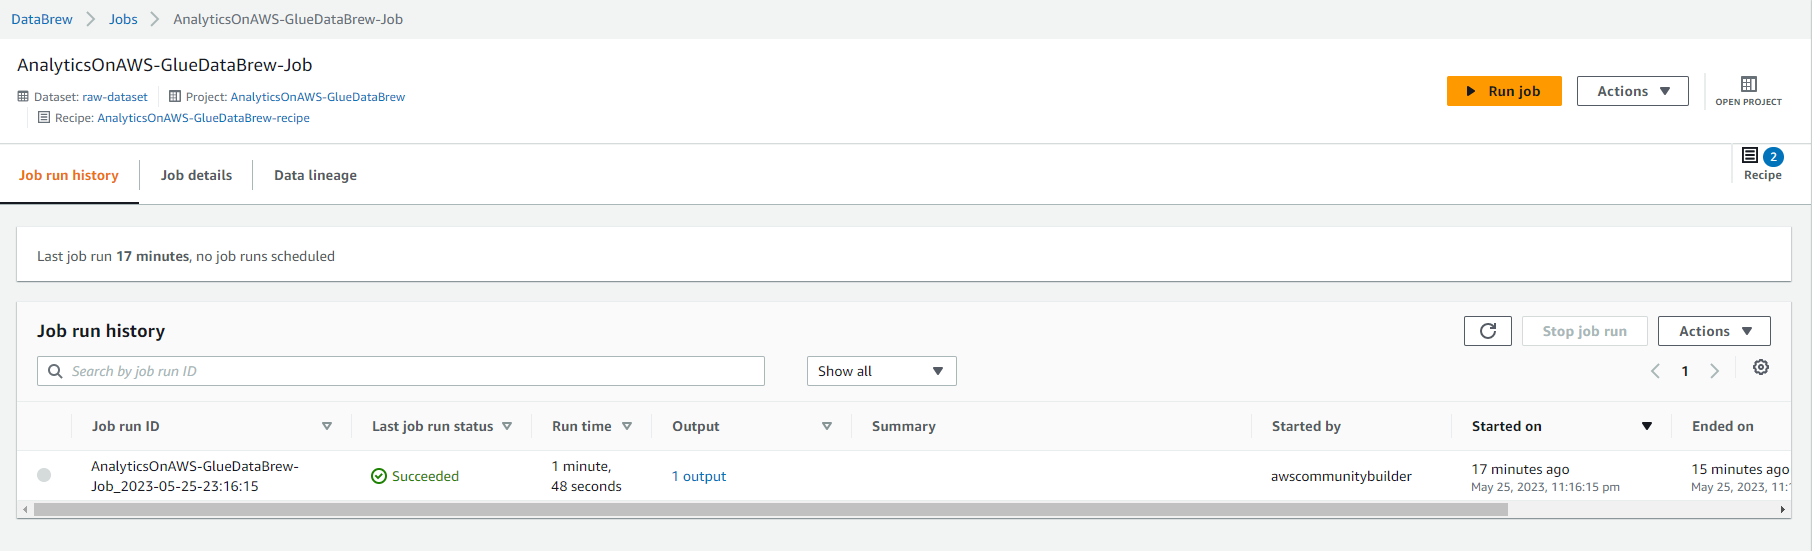
- This job should take about 4-5 minutes to complete, you should see Succeeded status and Select 1 result under Output column.