Analysis with Kinesis Data Analytics
Analytics with Kinesis Data Analytics
In the previous section, you discovered how to analyze data using Amazon Athena. In this section, we will see how to perform real-time analysis of data in transit using Amazon Kinesis Data Analytics. This can be done in 2 ways, using old SQL Applications or using new Studio Notebooks is recommended. In this practice session, we will use Studio Notebook and create a SQL-based Kinesis Analytics Application.
Create IAM Role
In this step, we will navigate to the IAM Console and create a new Amazon Kinesis Data Analytics service role. This allows the Amazon Kinesis Data Analytics service to access the Kinesis Data Streams as well as the AWS Glue Catalog table.
- Go to the AWS IAM Role Role
- Select Create IAM Role
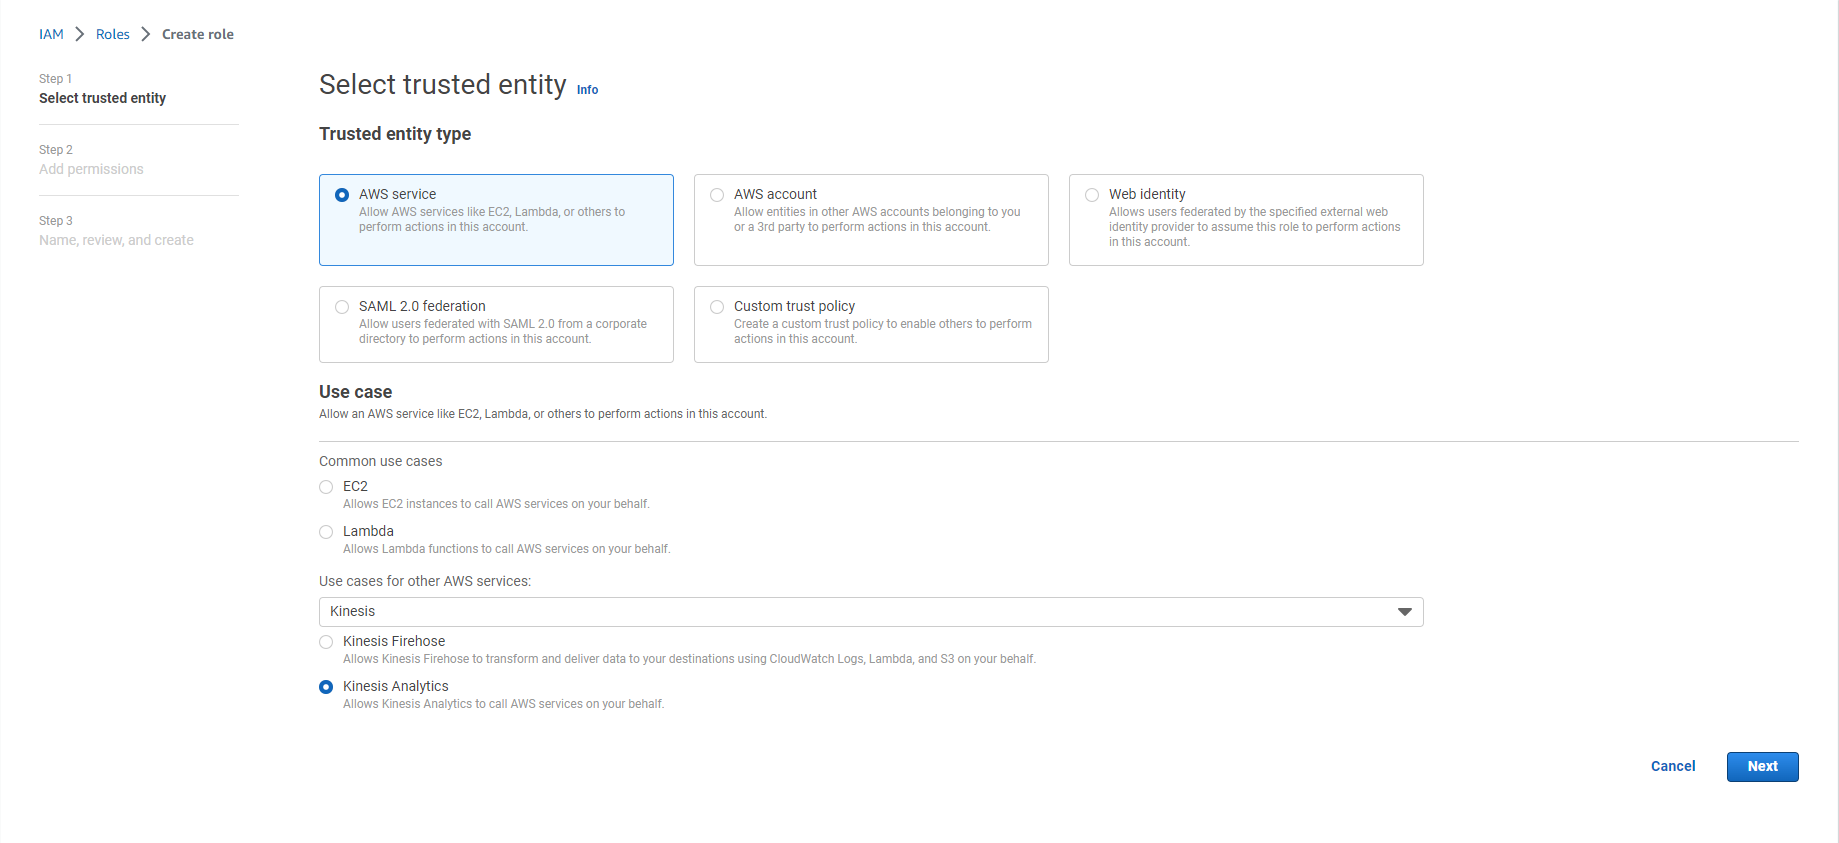
- Select the Kinesis service in the Use case from the drop-down menu named Use cases for other AWS services:
- Select Kinesis Analytics
- Select Next
- Search for AWSGlueServiceRole
- Select the input checkbox of this item
- Search AmazonKinesisFullAccess
- Select the input checkbox of this item
NOTE: We use full access for practice purposes only. Please grant necessary access if you use this Role in production environment.
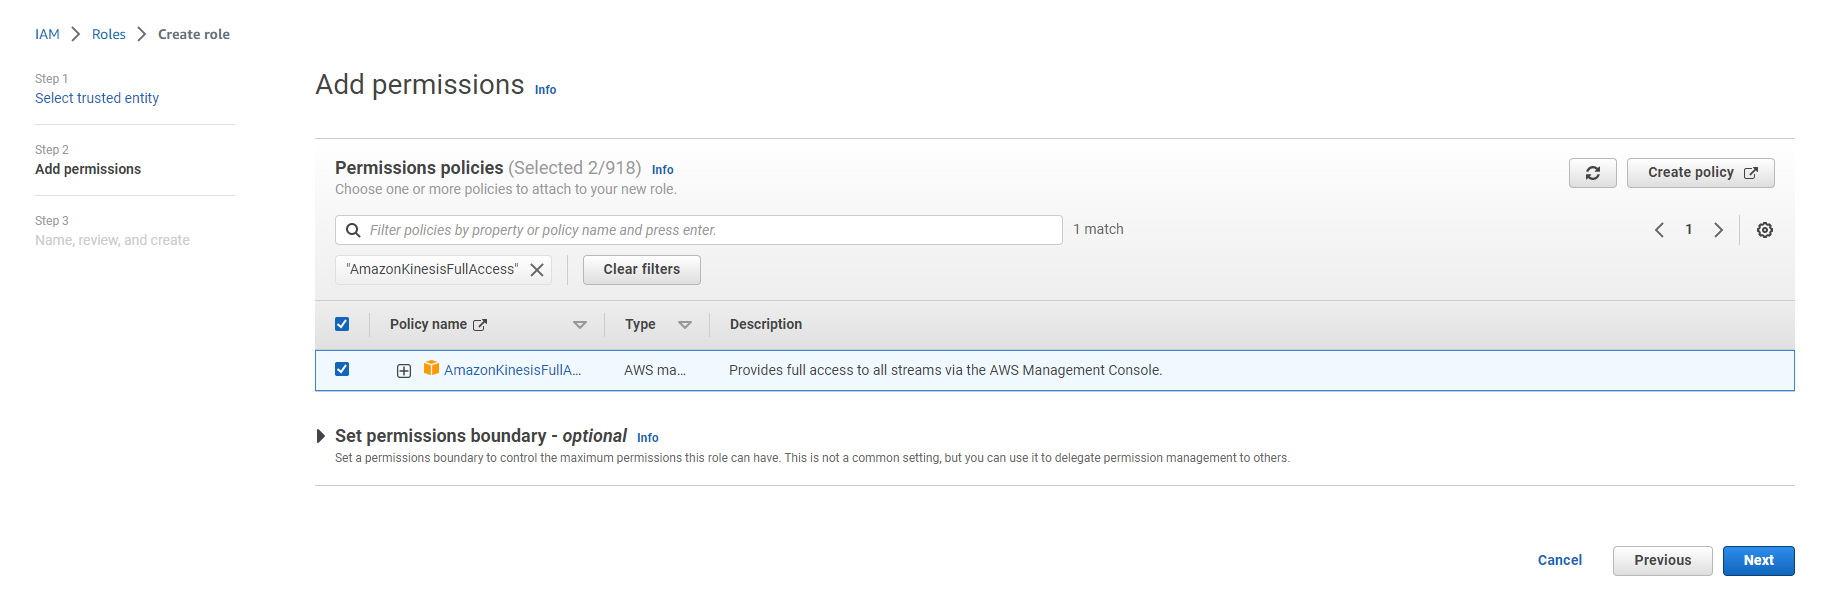
- Select Next
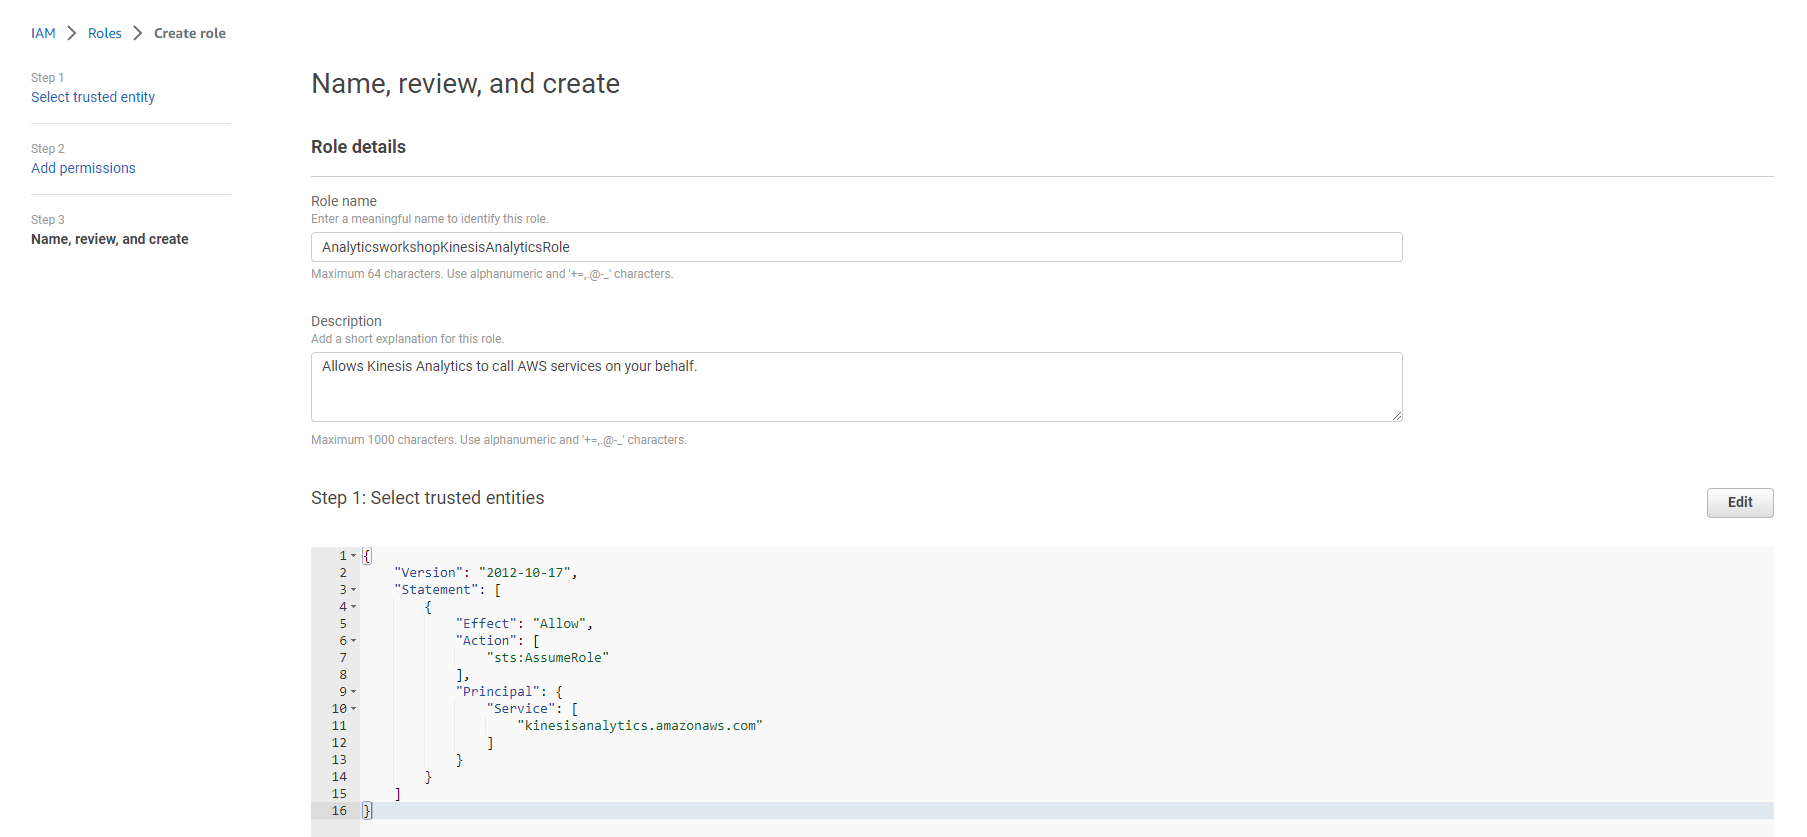
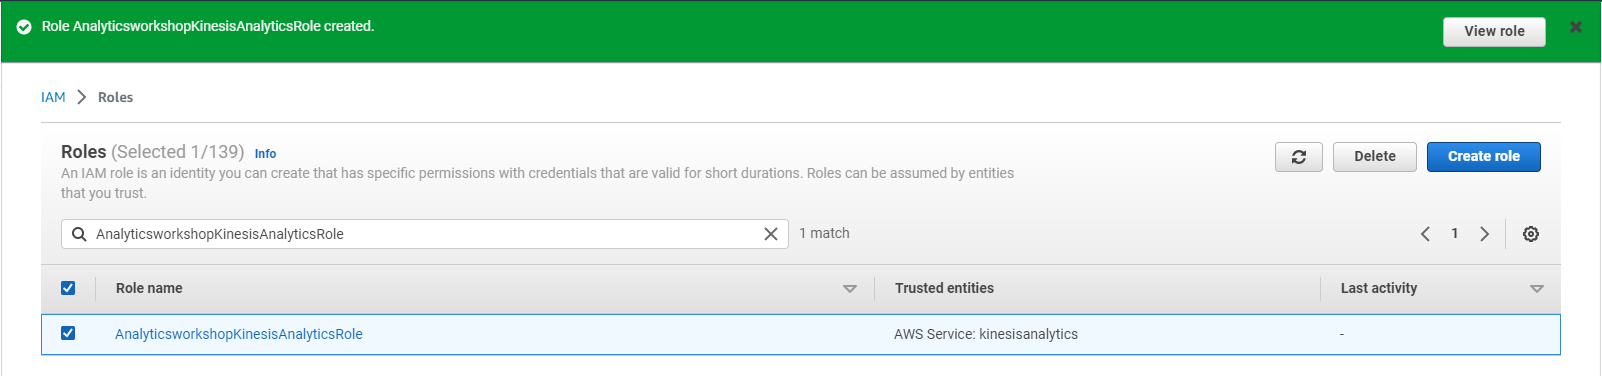
- Enter Role name: AnalyticsworkshopKinesisAnalyticsRole
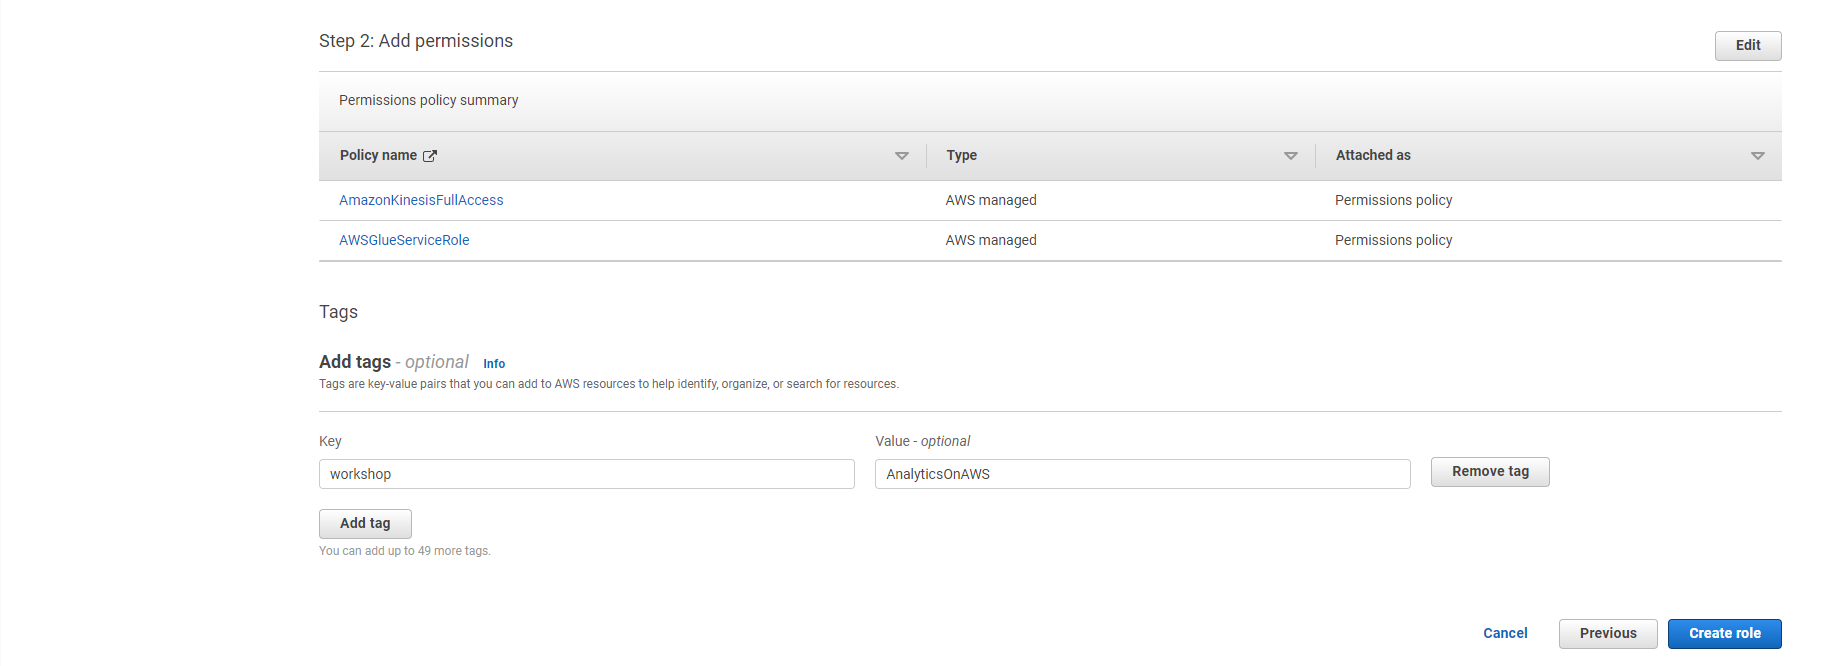
- Make sure only two policies are attached to this Role (AWSGlueServiceRole, AmazonKinesisFullAccess)
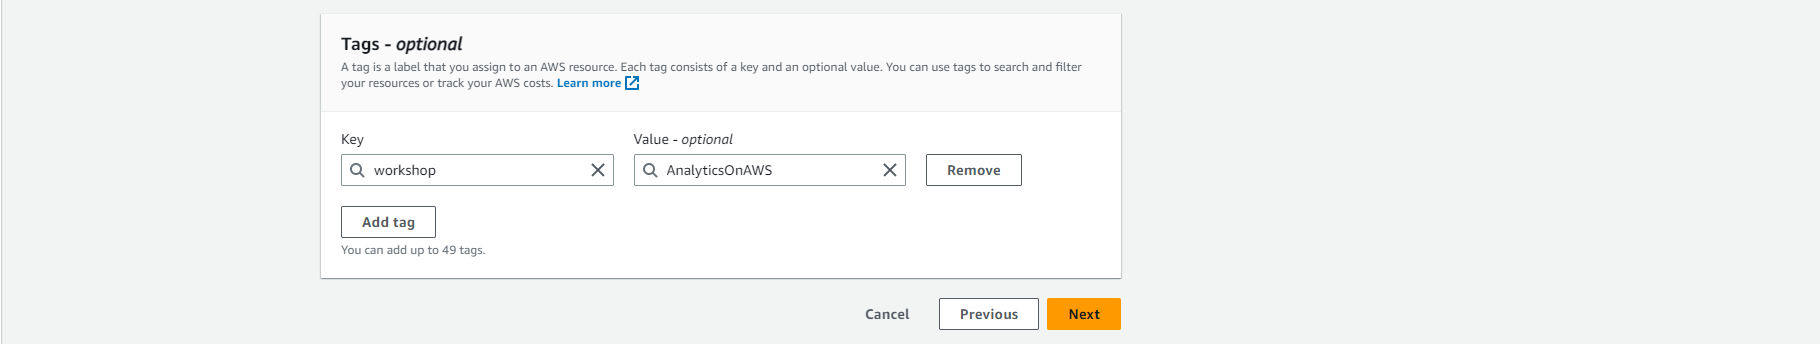
- Option to add Tag, for example: workshop: AnalyticsOnAWS
- Select Create IAM Role
Create Kinesis Data Stream
Kinesis Data Generator is an application that makes it simple to send test data to an Amazon Kinesis stream or an Amazon Kinesis Firehose delivery flow. We will create a Kinesis data stream to receive data from the Kinesis Data Generator. Notebook Our Kinesis Application will read the data in transit from this Kinesis data stream.
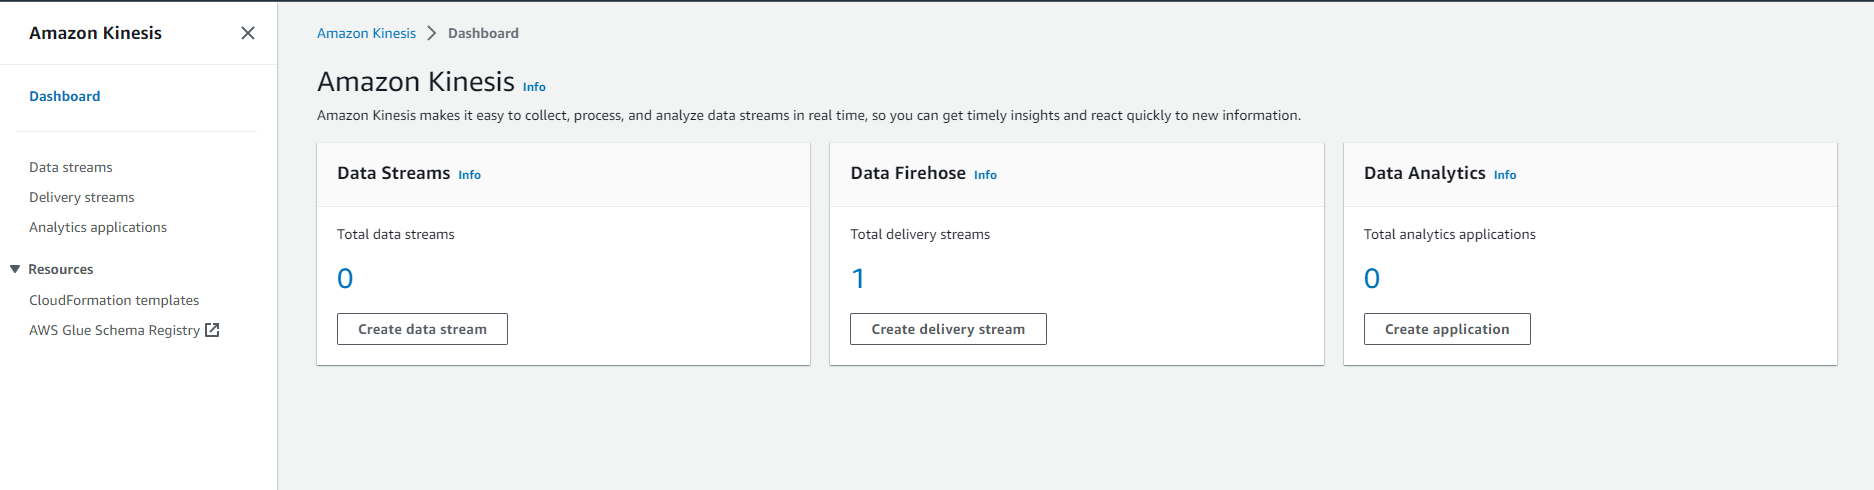
- Access to the AWS Kinesis service Select Create Data Stream
- Enter data stream name: analytics-workshop-data-stream
- Data Stream capacity:
- Choose Capacity Mode: Provisioned
- Set Provisioned Shards: 2
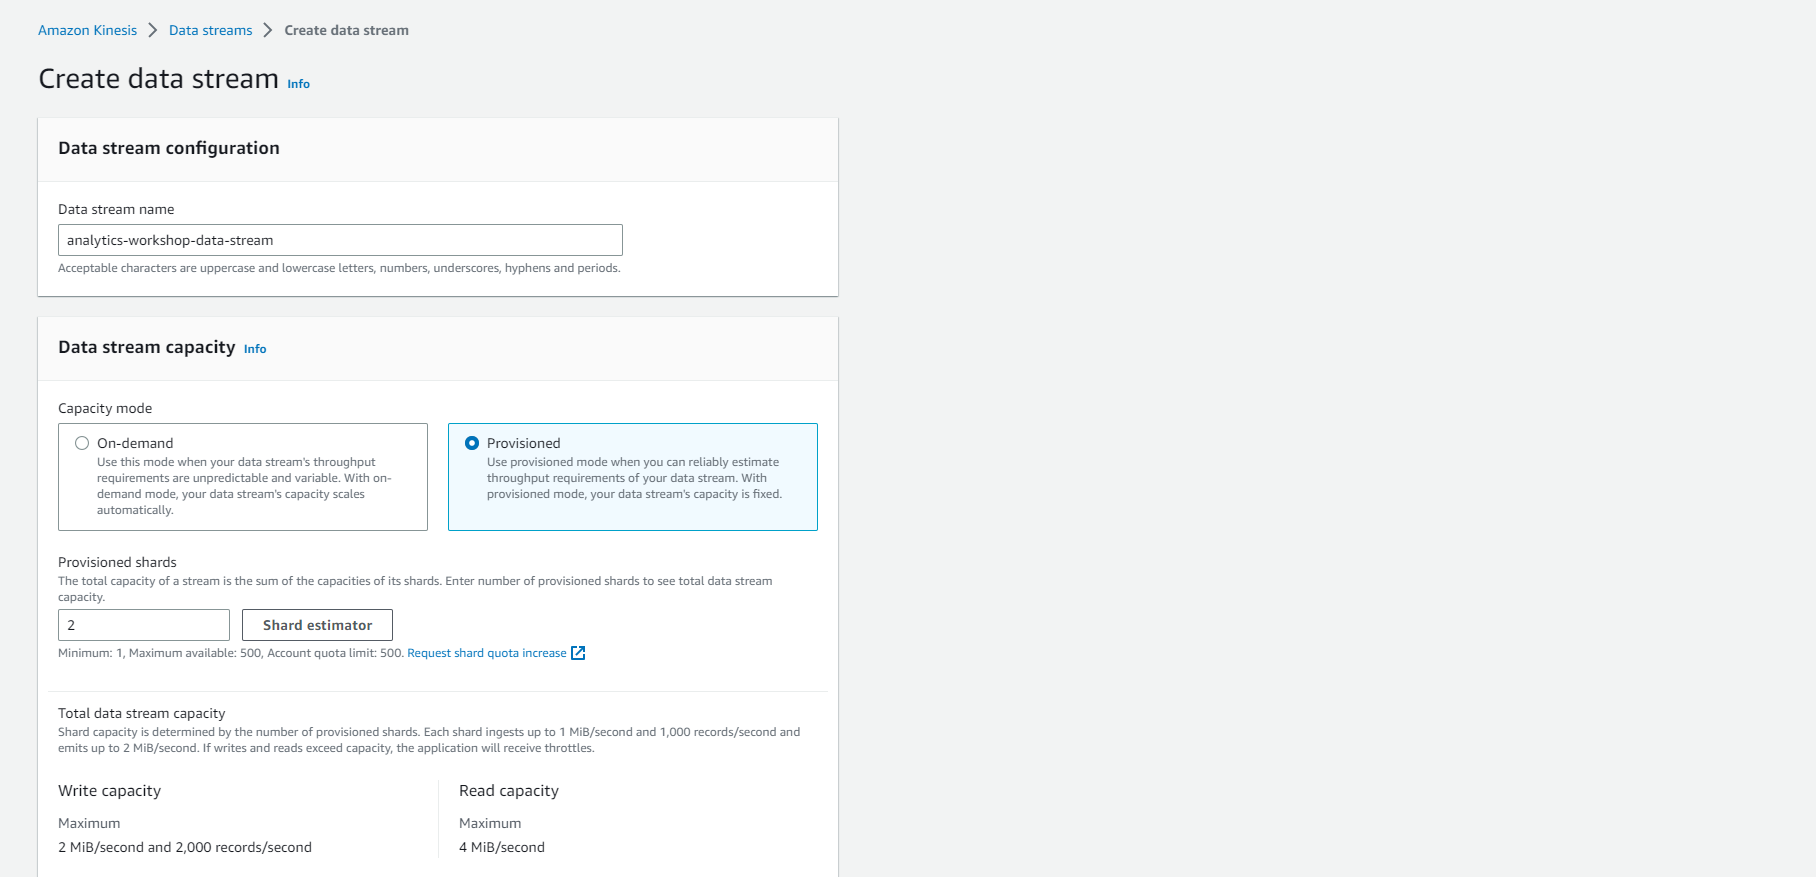
- INFORMATION: A shard is a special group of data records defined in a Kinesis data stream. A shard supports 1 MB/s and 1,000 records per second for writes and 2 MB/s for reads. So the 2 shards allocated here can support 2 MB/s and 2,000 records per second for writes and 4 MB/s for reads.
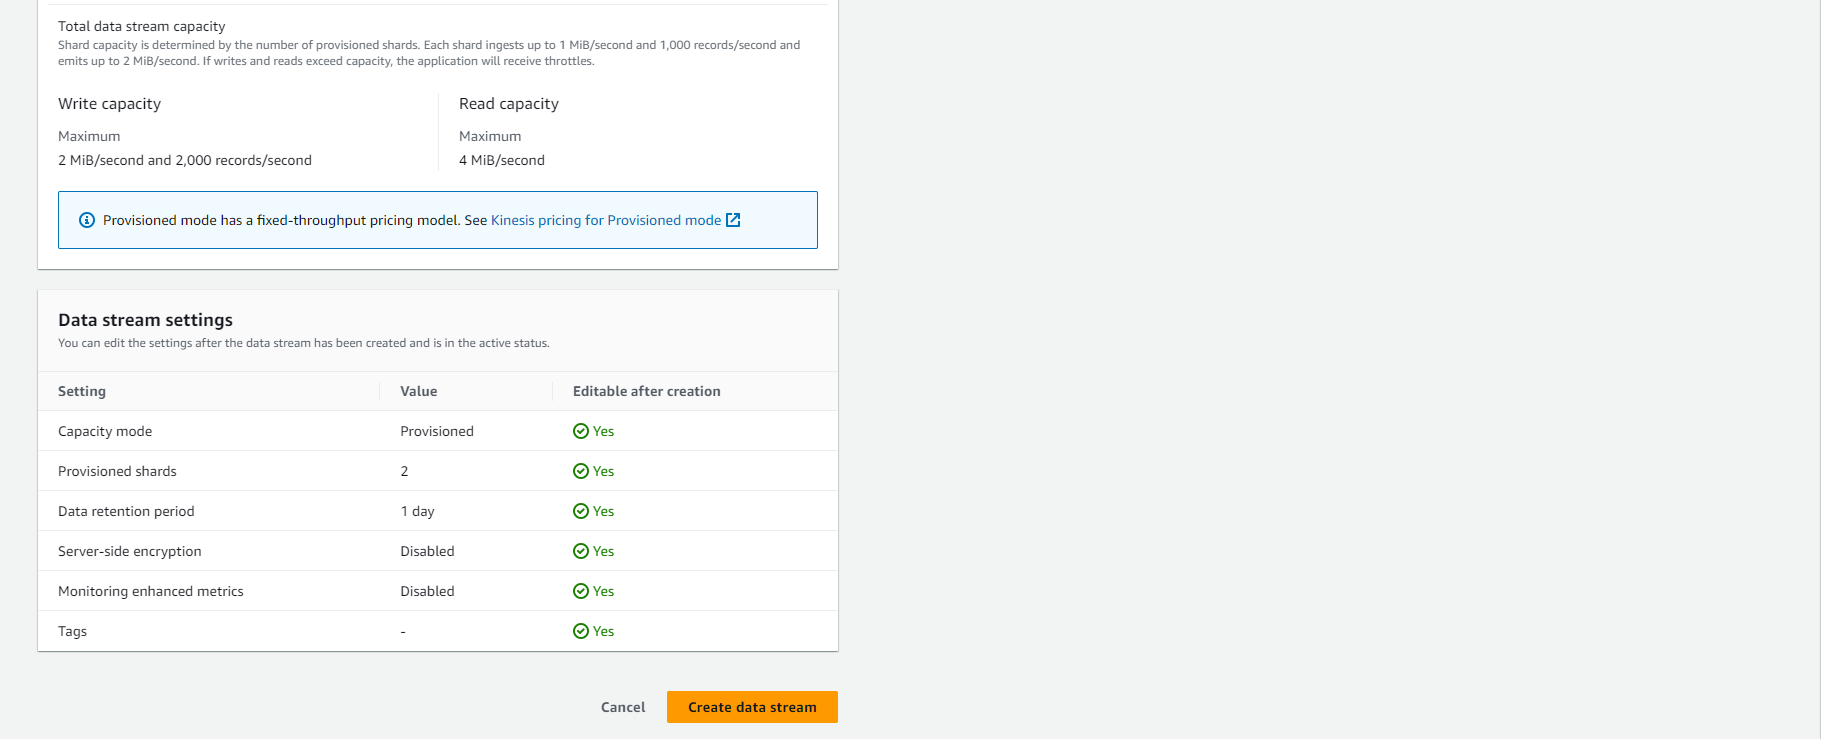
- Scroll to the bottom and Select Create Data Stream
Create Glue Catalog Table
Our Kinesis Application Notebook pulls data source information from AWS Glue. When you create a Studio notebook, you specify the AWS Glue database that contains your connection information. When accessing your data source, you specify the AWS Glue tables that are contained in the database.
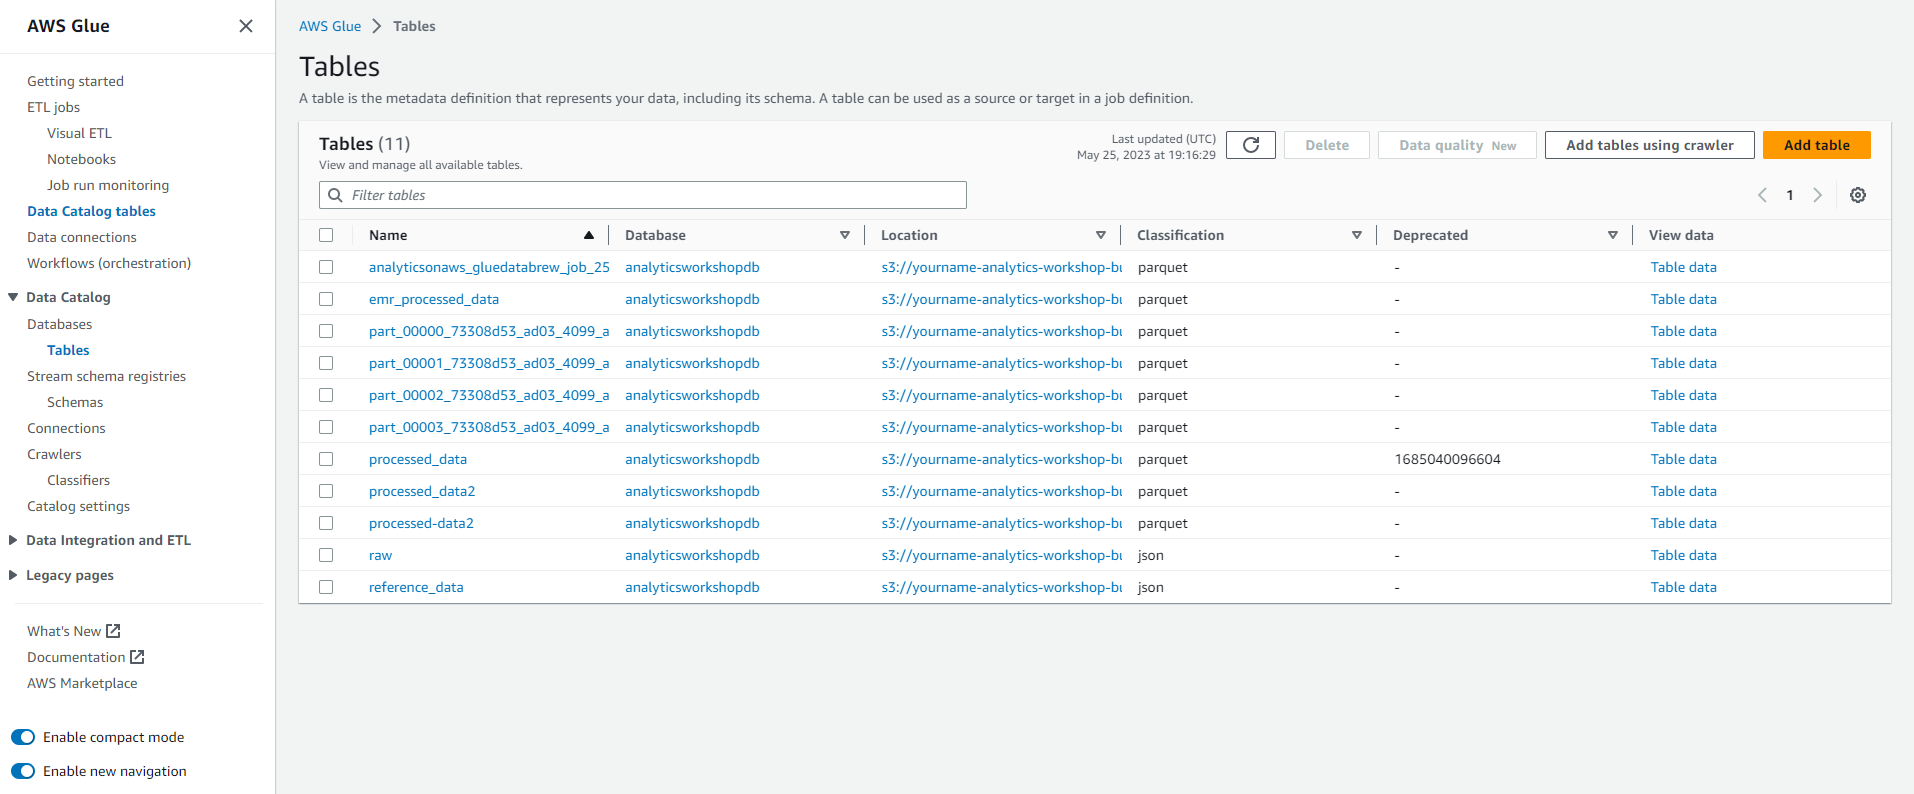
- From the left sidebar, go to Database and Select our previously created database analyticsworkshopdb
-
Select Tables in analyticsworkshopdb
-
Select the Add tables drop-down menu and then select Add table manually
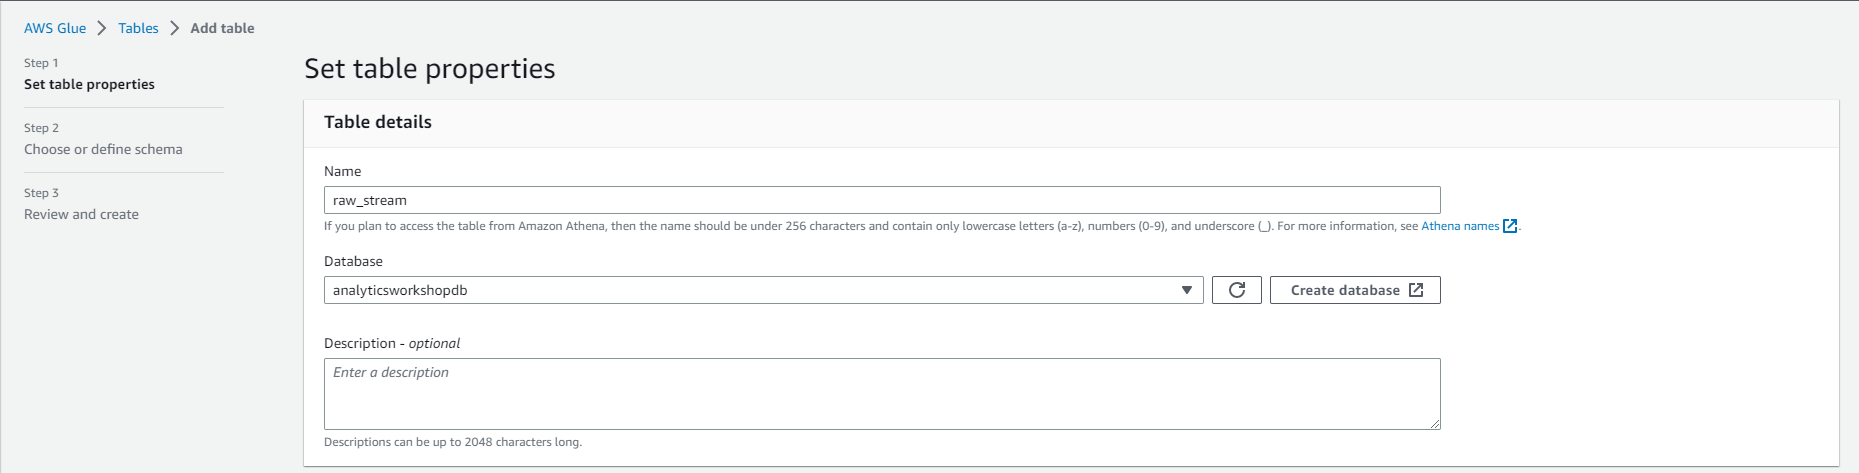
- In Table Properties
- Enter Table Name: raw_stream
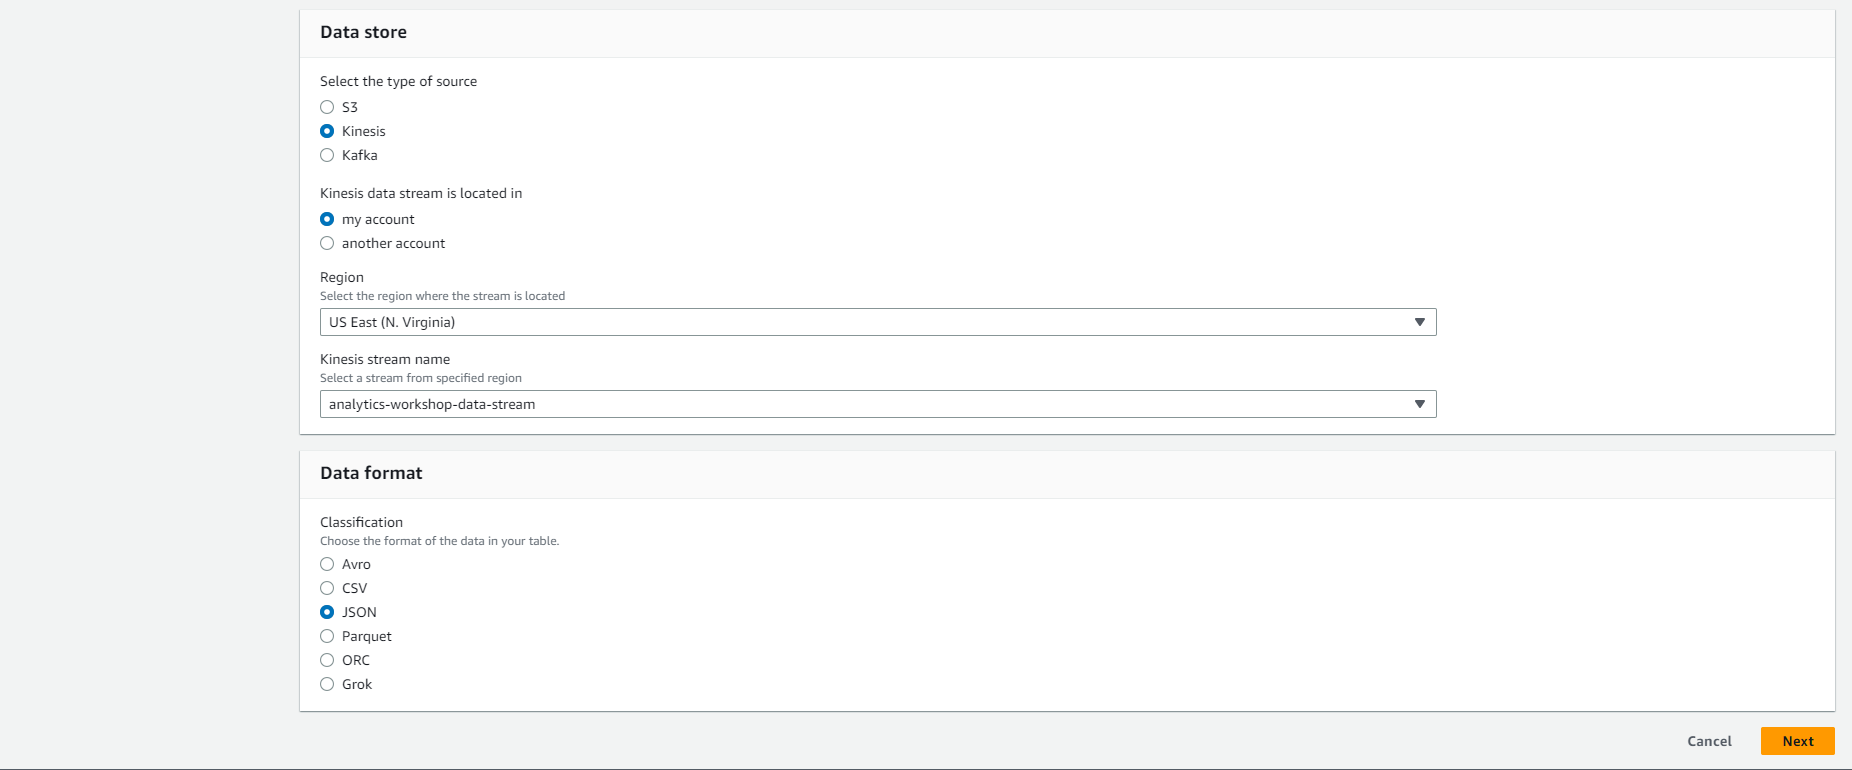
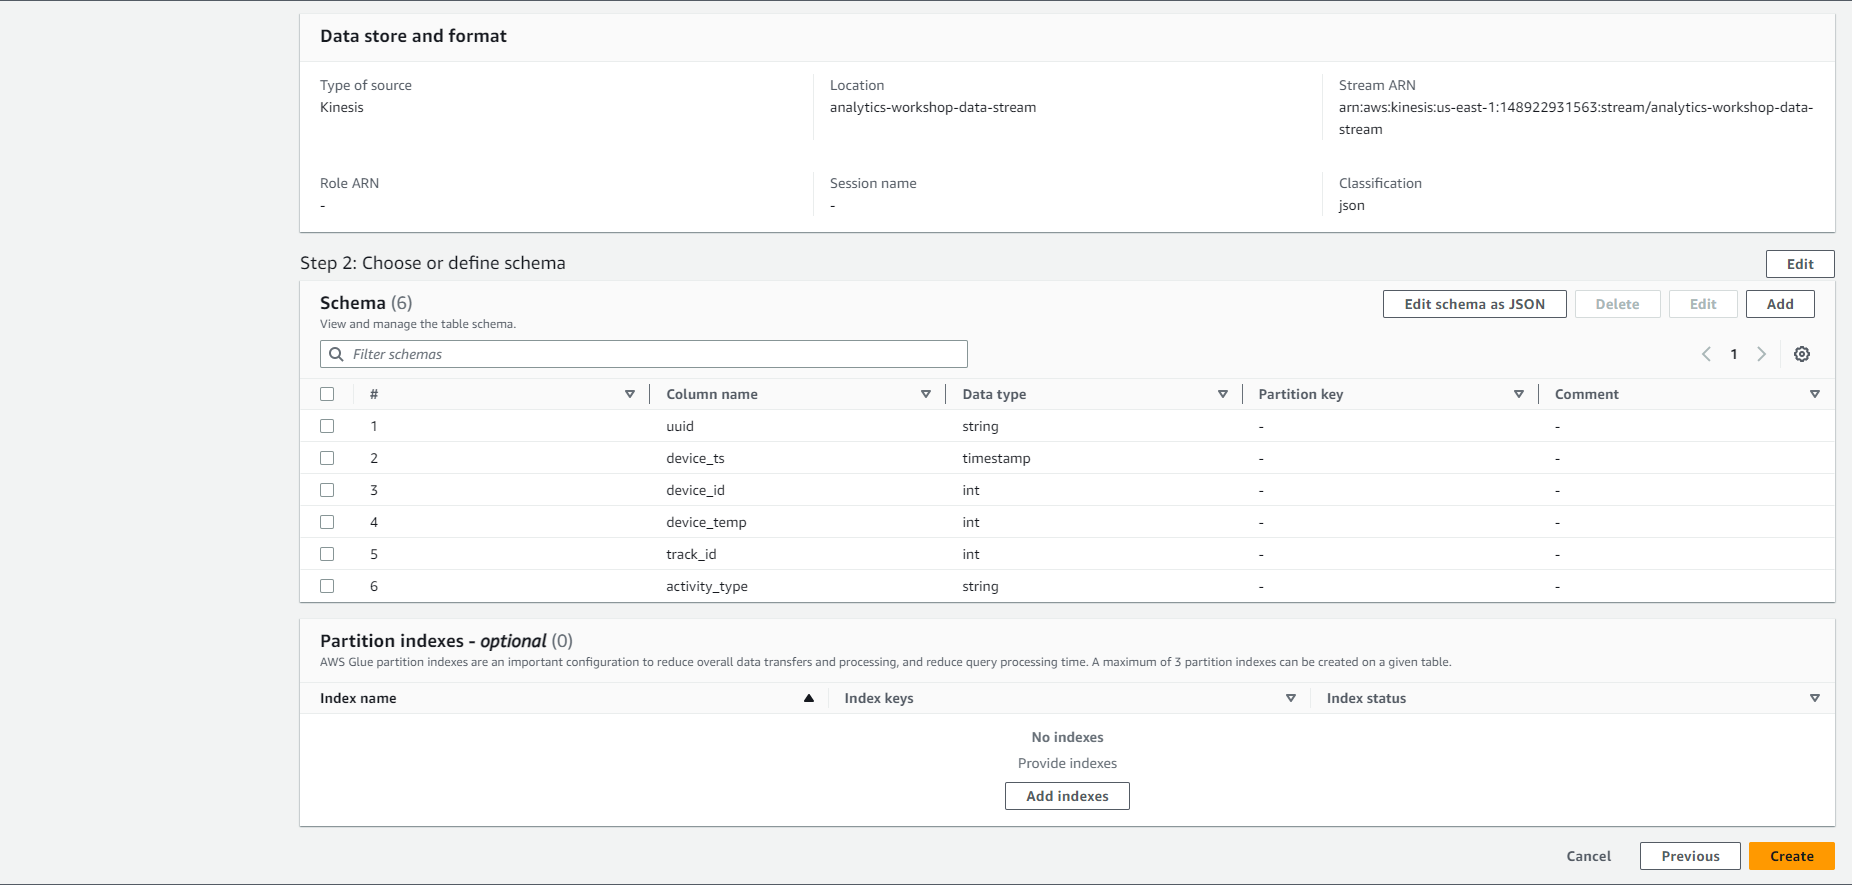
- In the Data store:
- Select source type: Kinesis
- Skip Select a kinesis data stream. (Stream in my account is selected by default)
- Region US East (N. Virginia) us-east-1
- Kinesis stream name analytics-workshop-data-stream
- Ignore sample size
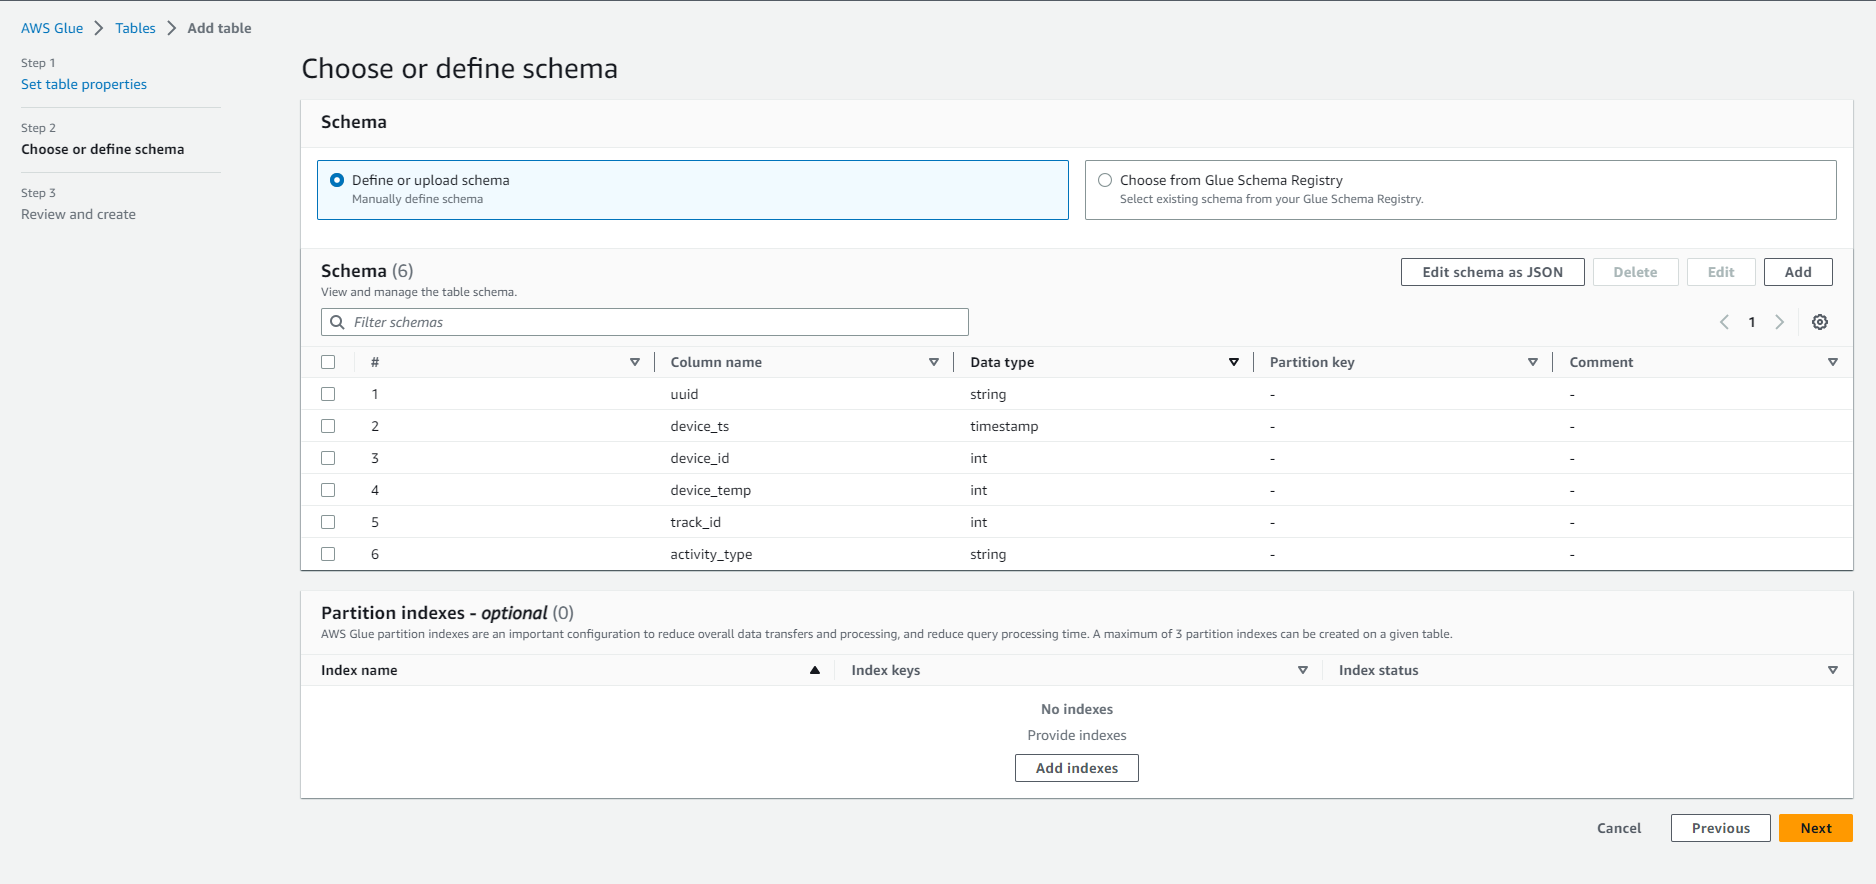
- In Data format:
- Classification: JSON
- Then, Select Next
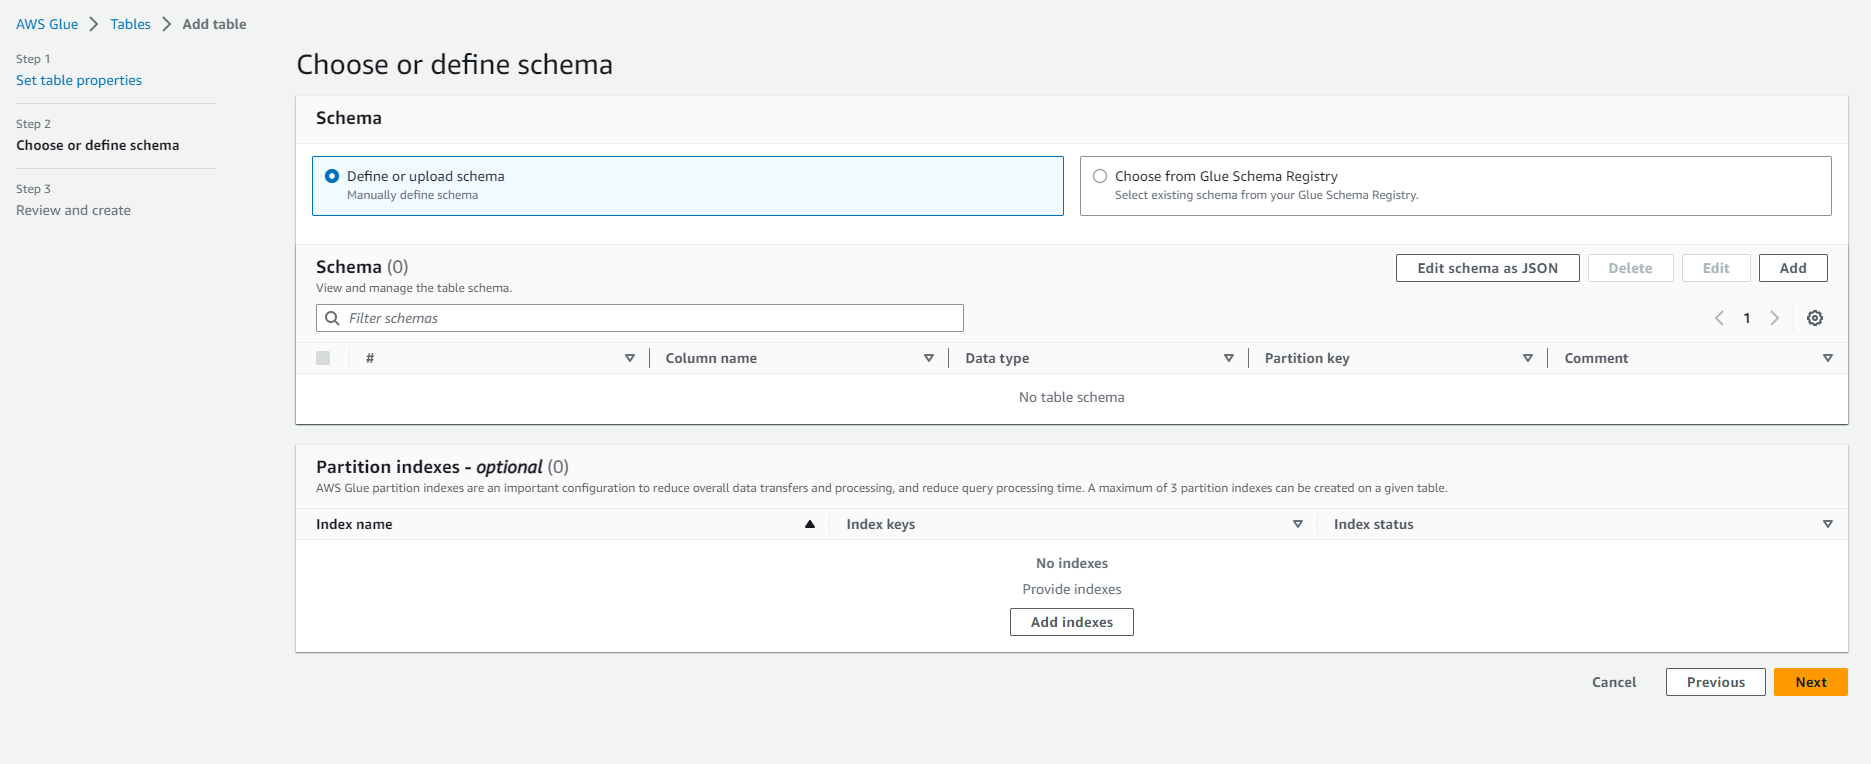
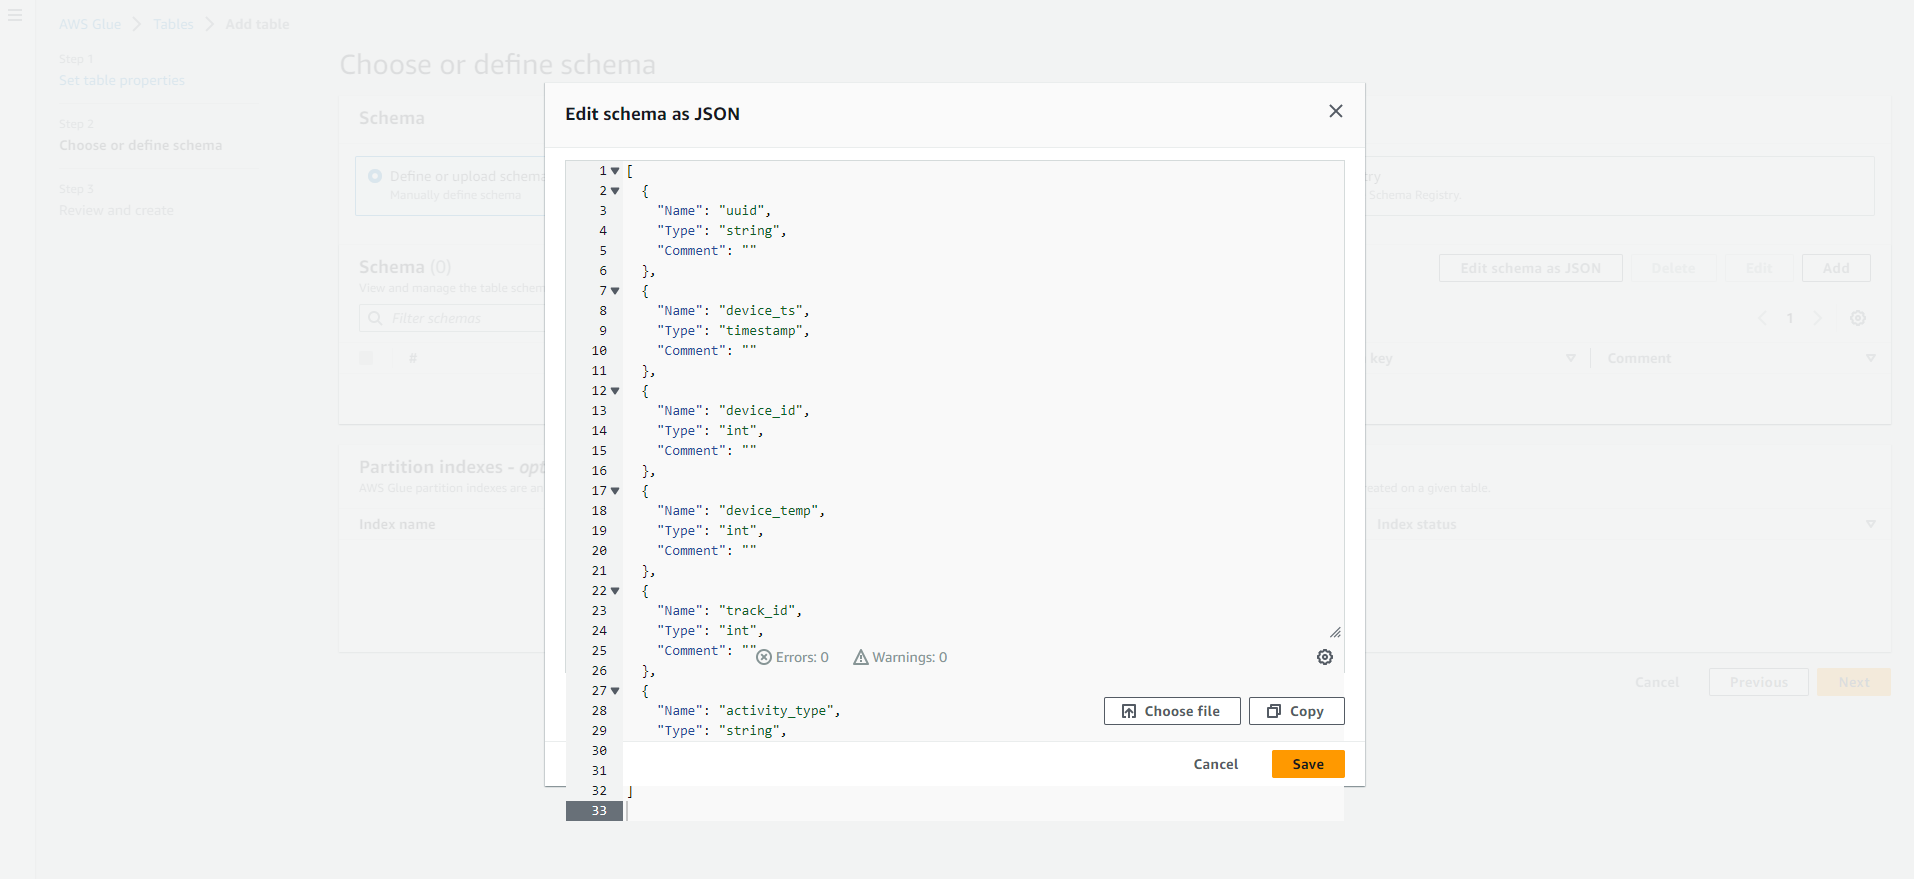
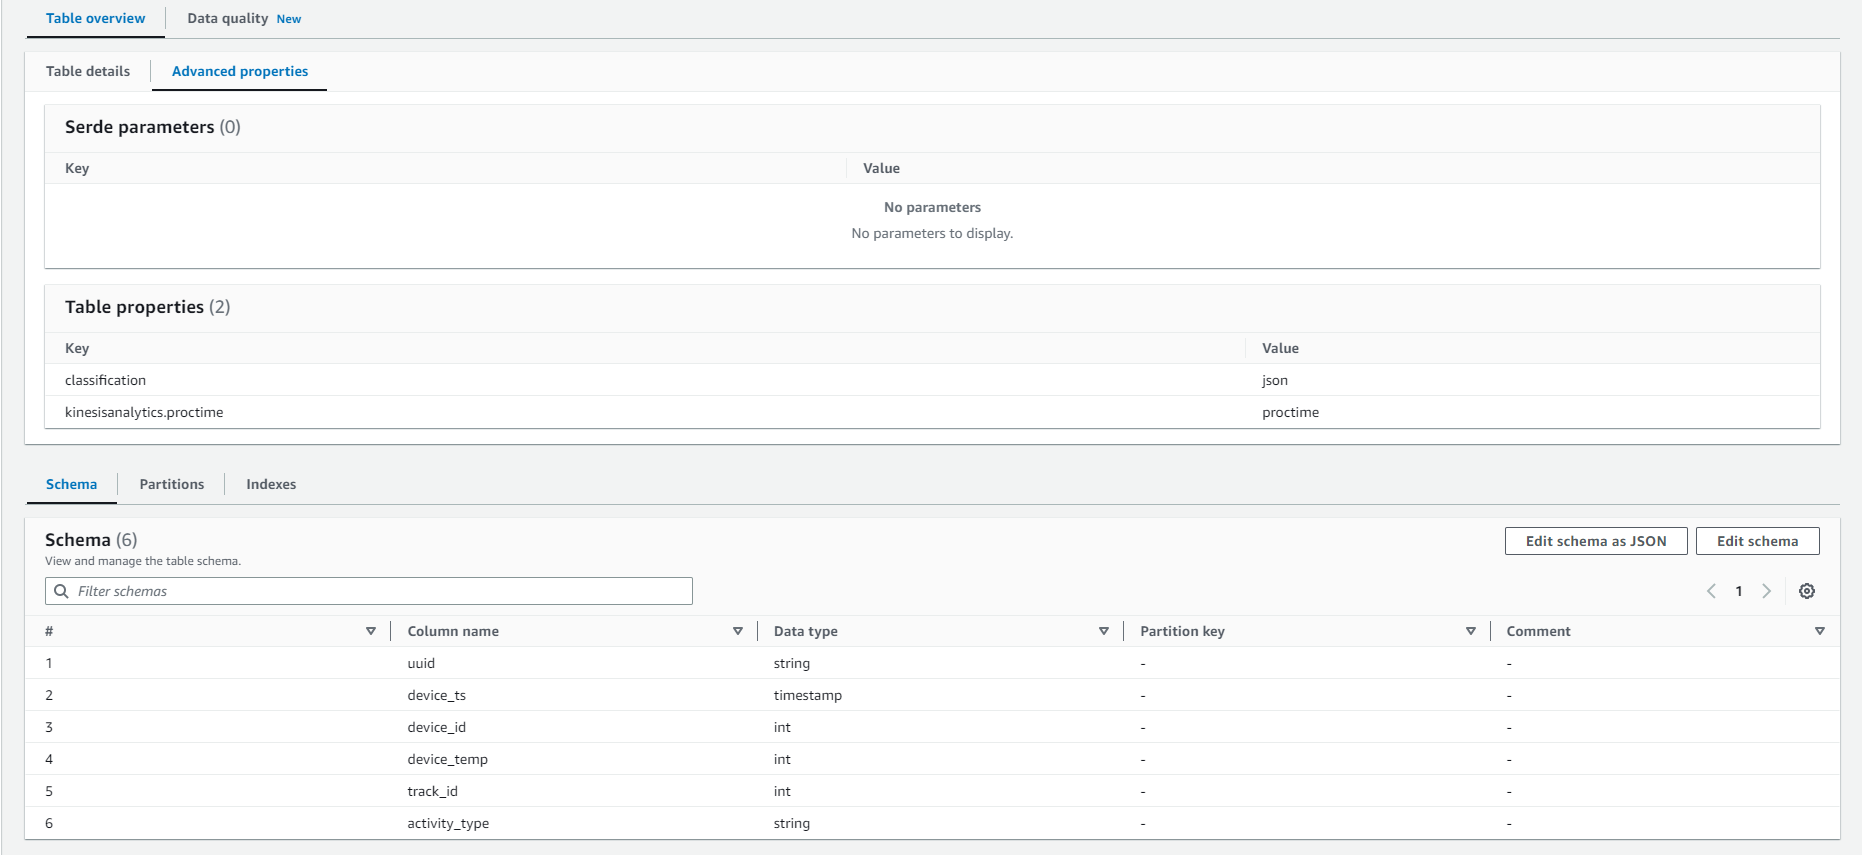
- In Schema: Select Edit Schema as JSON and insert the following JSON text.
[
  {
    "Name": "uuid",
    "Type": "string",
    "Comment": ""
  },
  {
    "Name": "device_ts",
    "Type": "timestamp",
    "Comment": ""
  },
  {
    "Name": "device_id",
    "Type": "int",
    "Comment": ""
  },
  {
    "Name": "device_temp",
    "Type": "int",
    "Comment": ""
  },
  {
    "Name": "track_id",
    "Type": "int",
    "Comment": ""
  },
  {
    "Name": "activity_type",
    "Type": "string",
    "Comment": ""
  }
]
- In Schema: Then Click Next
- In Partition: Skip this section and Select Next INFO: Partition index is an index for the partition keys defined in the table. This is useful for retrieving a subset of partitions instead of loading all partitions. Find detailed information here.
-
Select Next
-
Check that all information is correct, then Click on Create
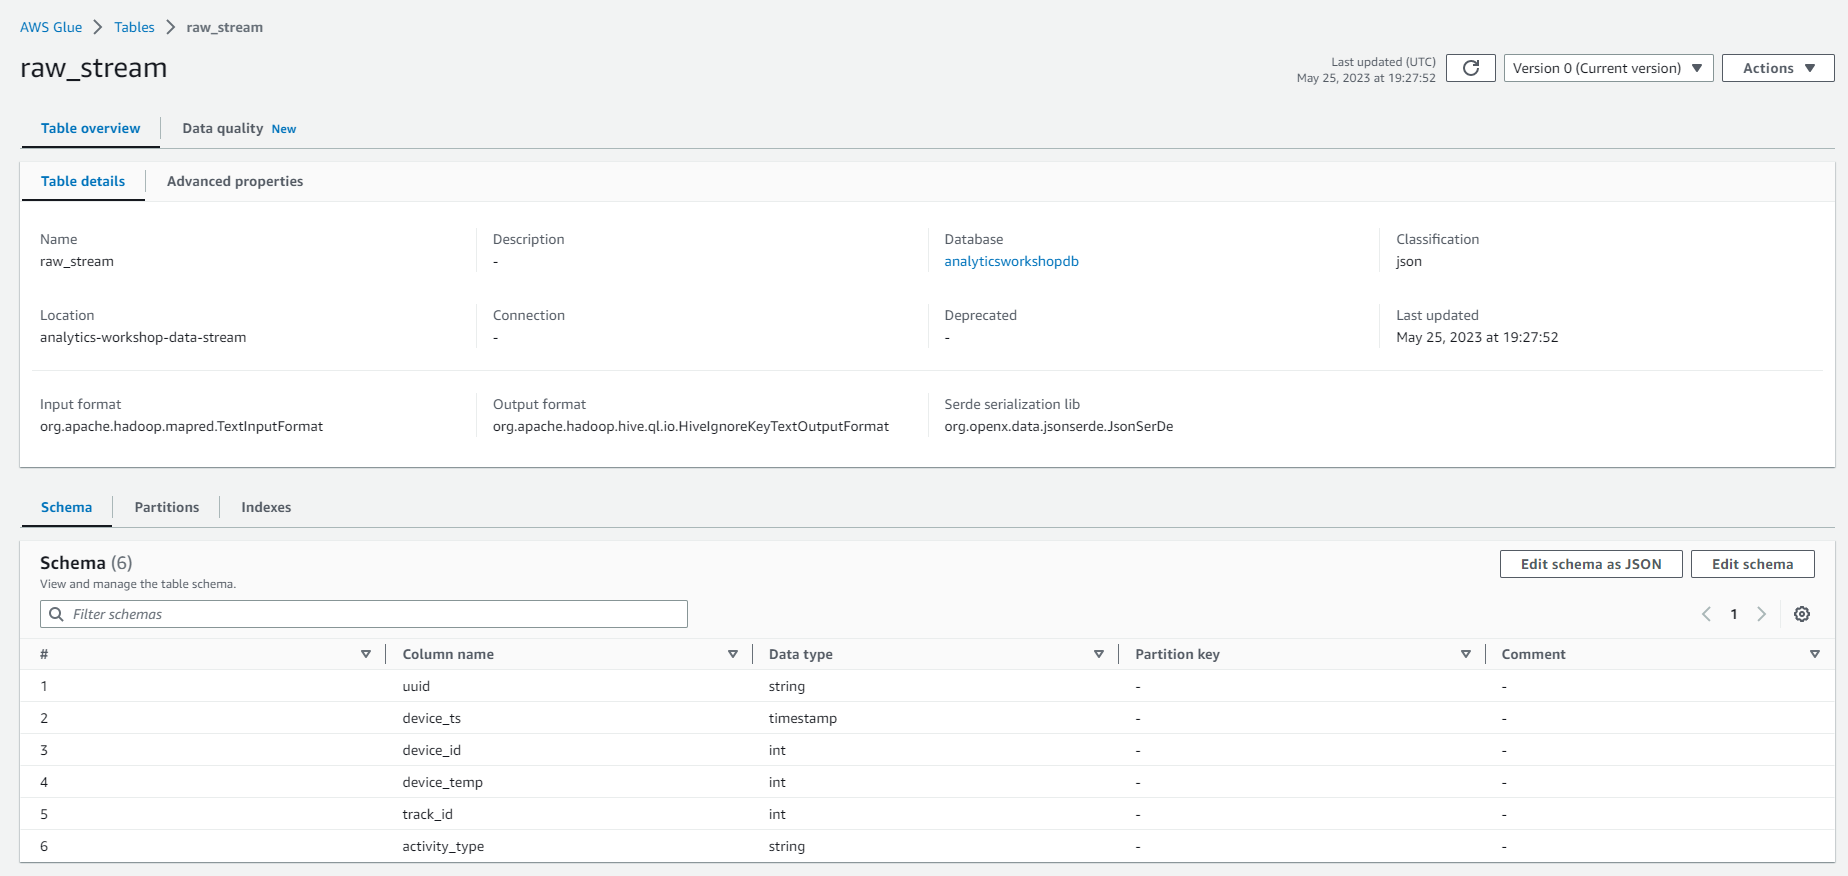
- Verify that the new Glue table raw_stream has been properly created. Refresh the table list if it is not already visible.
-
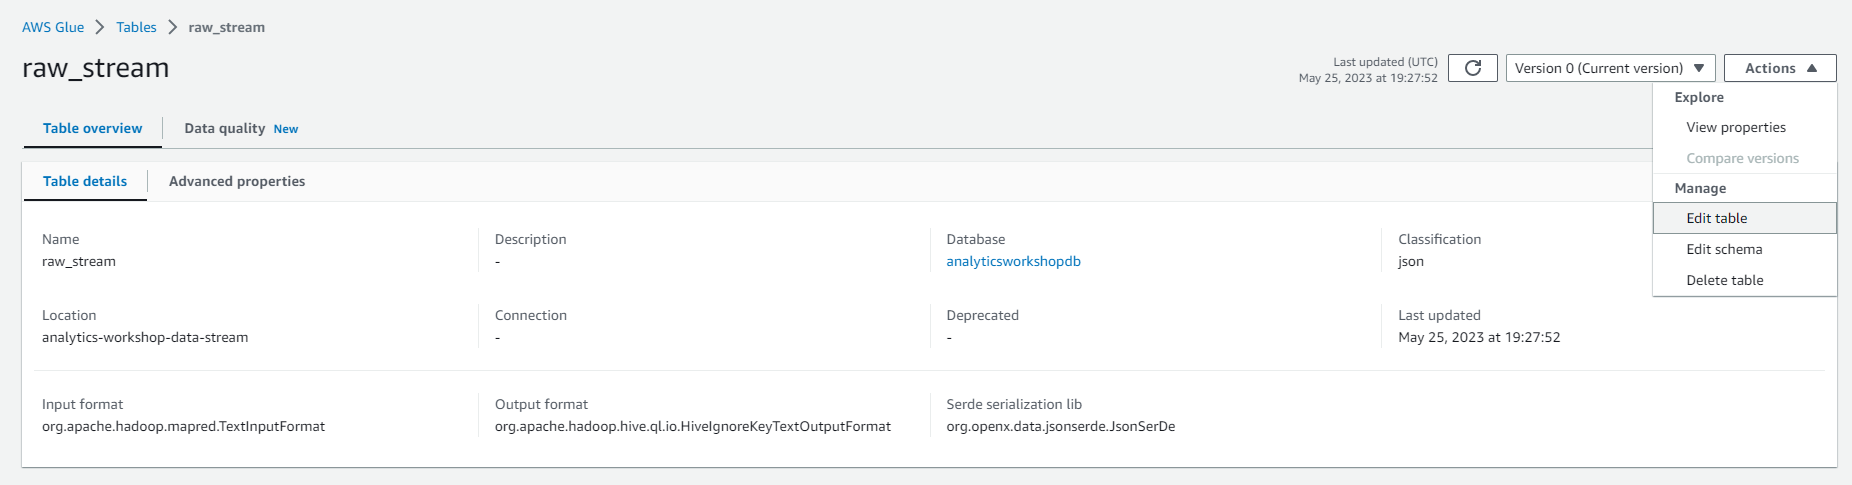
Select the newly created table raw_stream
-
Select on Actions and Select on Edit table
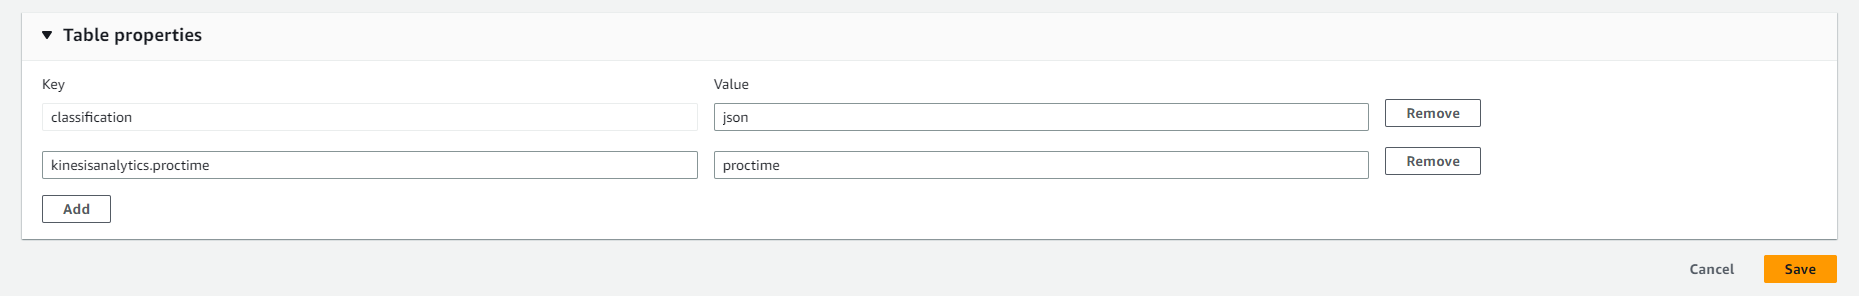
- Under Table properties, add a new property:
- Key: kinesisanalytics.proctime
- Value: proctime
- INFO: These key-value attributes indicate how long Kinesis Analytics data has been processed
Create Analytics Streaming Application Studio Notebook
Now let’s create our Kinesis Analytics Streaming Application Studio Notebook in Kinesis Analytics Studio. This Kinesis Analytics Streaming Application Studio Notebook can process stream data from Kinesis Data Stream and we can write SQL analytics queries to get real-time information like current activity count or device temperature.
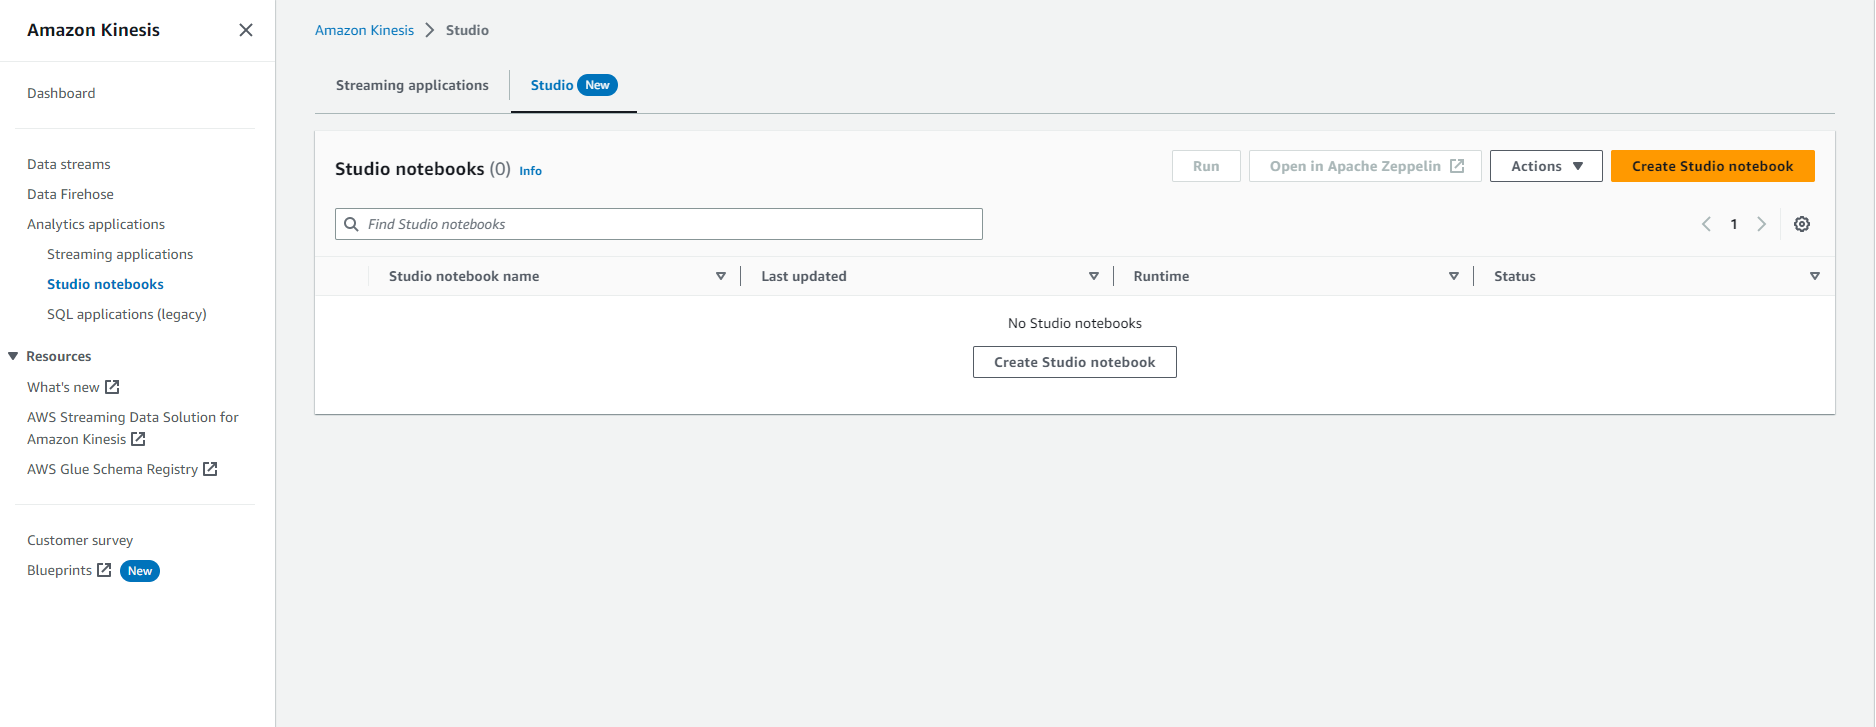
- Go to Studio
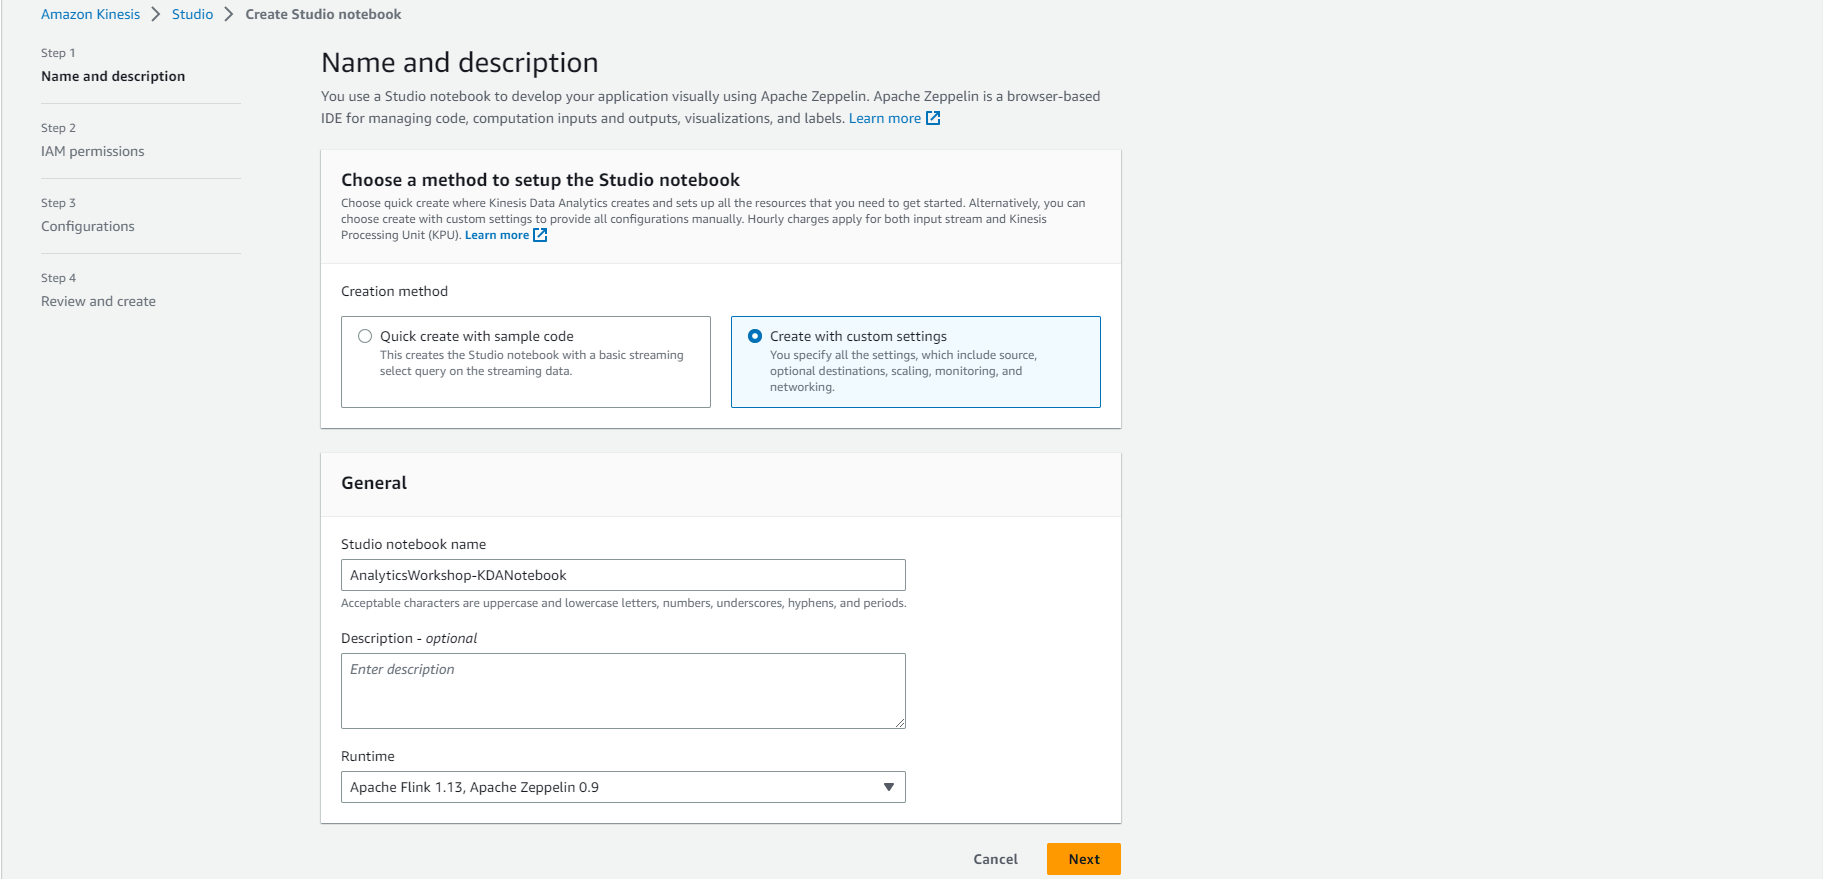
- Select Create Studio notebook
- Select Create with custom settings
- Enter Studio notebook name: AnalyticsWorkshop-KDANotebook
- Enter Runtime: Apache Flink 1.11, Apache Zeppelin 0.9
- Select Next
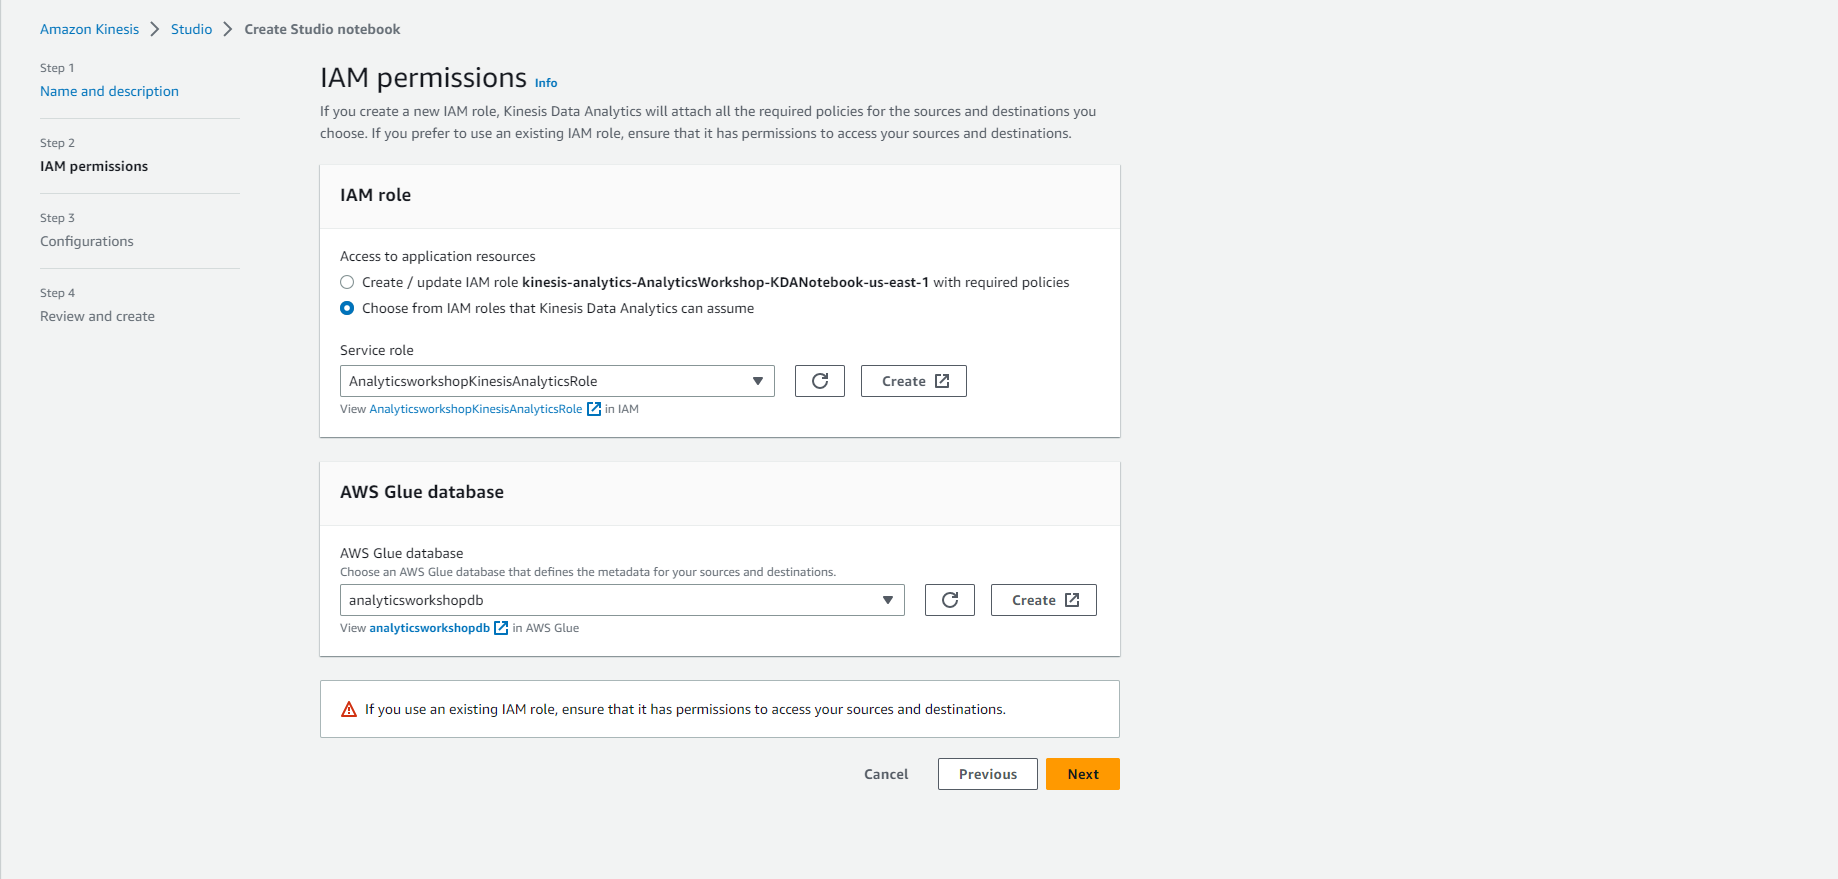
- In IAM role
- Select Choose from IAM roles that Kinesis Data Analytics can assume
- Select our previously created Service Role: AnalyticsworkshopKinesisAnalyticsRole
- In the AWS Glue database, select: analyticsworkshopdb
- Select Next
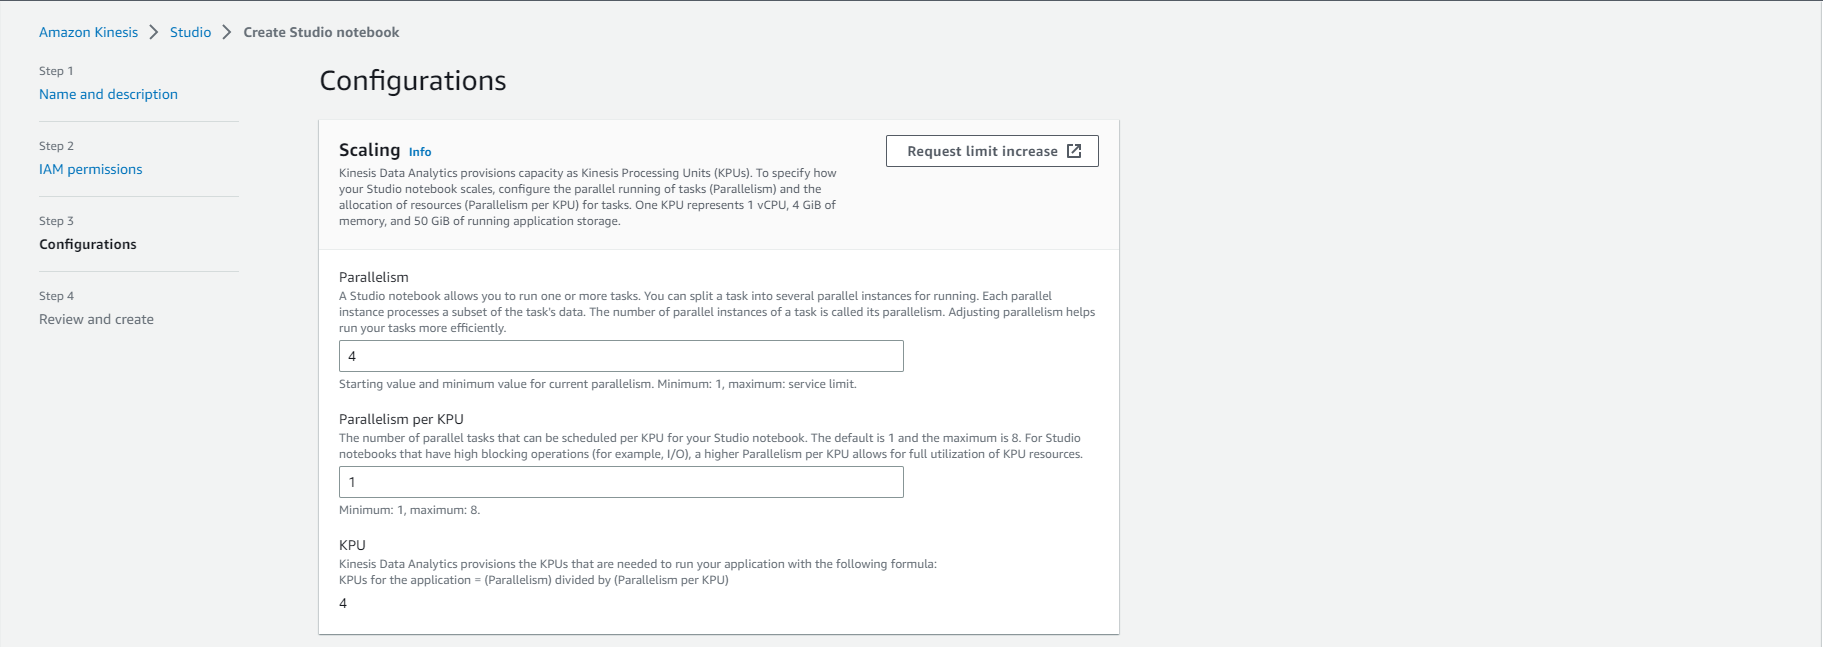
- In Configurations
- Parallelism: 4
- Parallelism per KPU: 1
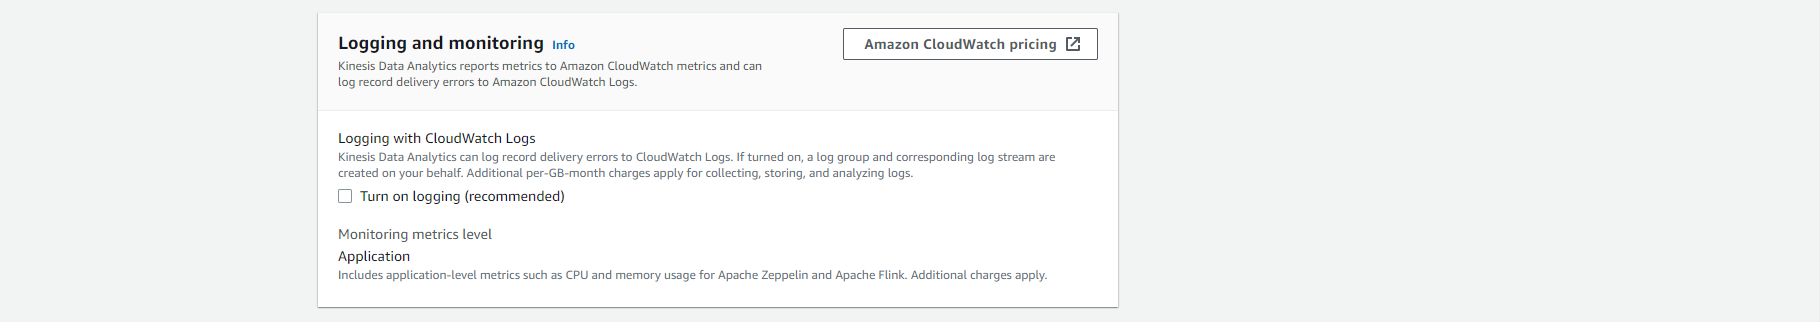
- Don’t enable Turn on Logging (Uncheck the Enable Logging check box)
-
INFO: Useful logging to understand errors when your application crashes. To do this, it is necessary to add the CLoudwatchFullAccess and CloudwatchLogFullAccess permissions to the service role. We will skip this part because it is not needed in this exercise.
-
Skip everything and scroll to the bottom
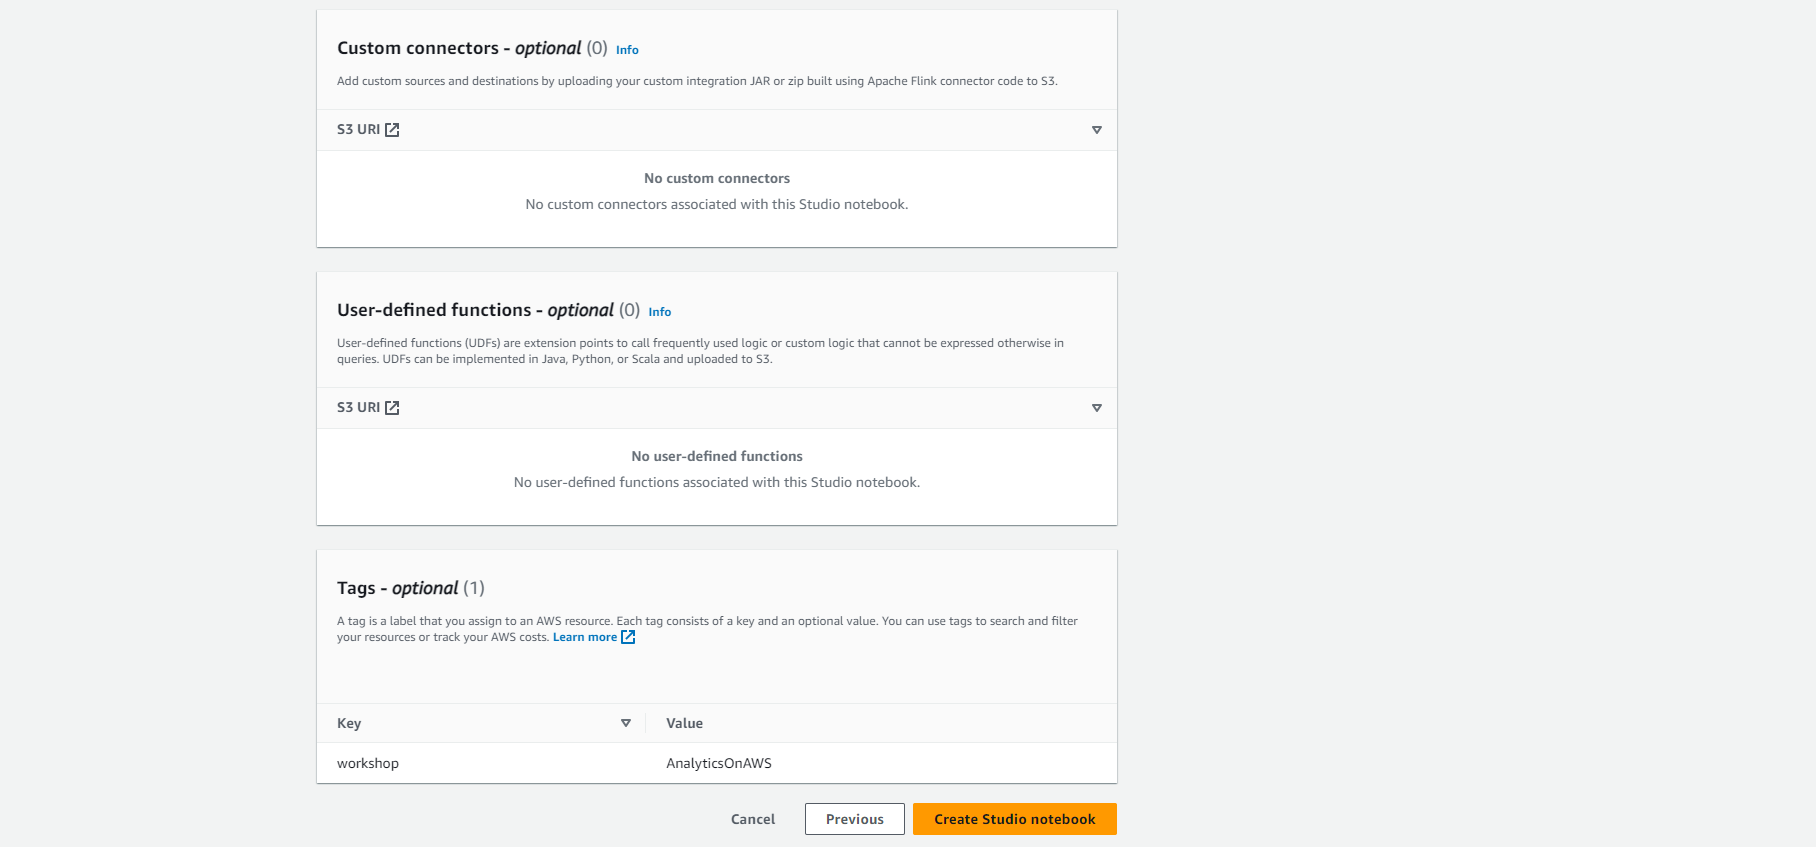
- In Tags:
- Optionally add tags, for example: workshop: AnalyticsOnAWS
- Select Next
- In Review and create
- Confirm that all values are correct
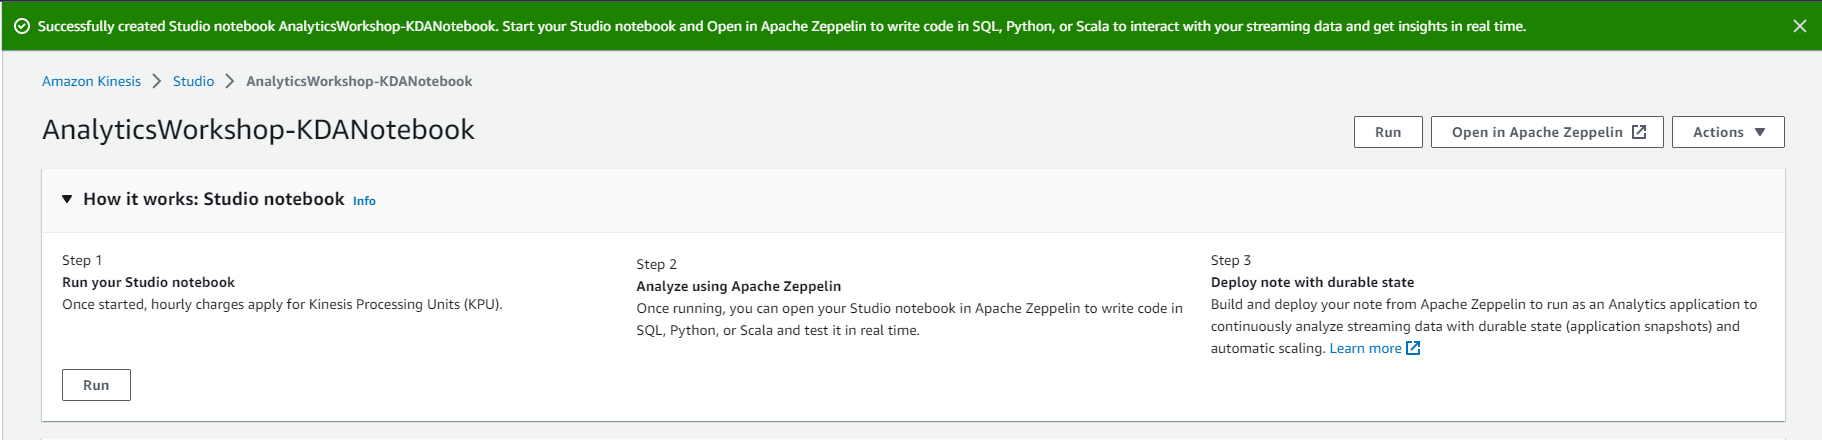
- Select Create Studio notebook
- Run Kinesis Analytics Studio Notebook
-
Now that we have created the Notebook, we can run it and try to execute some SQL queries.
-
View the list of Notebooks in the Studio tab and Select our newly created Notebook AnalyticsWorkshop-KDANotebook.
-
Select Run
-
Wait until the Status changes to Running mode. (This will take about 5-7 minutes)
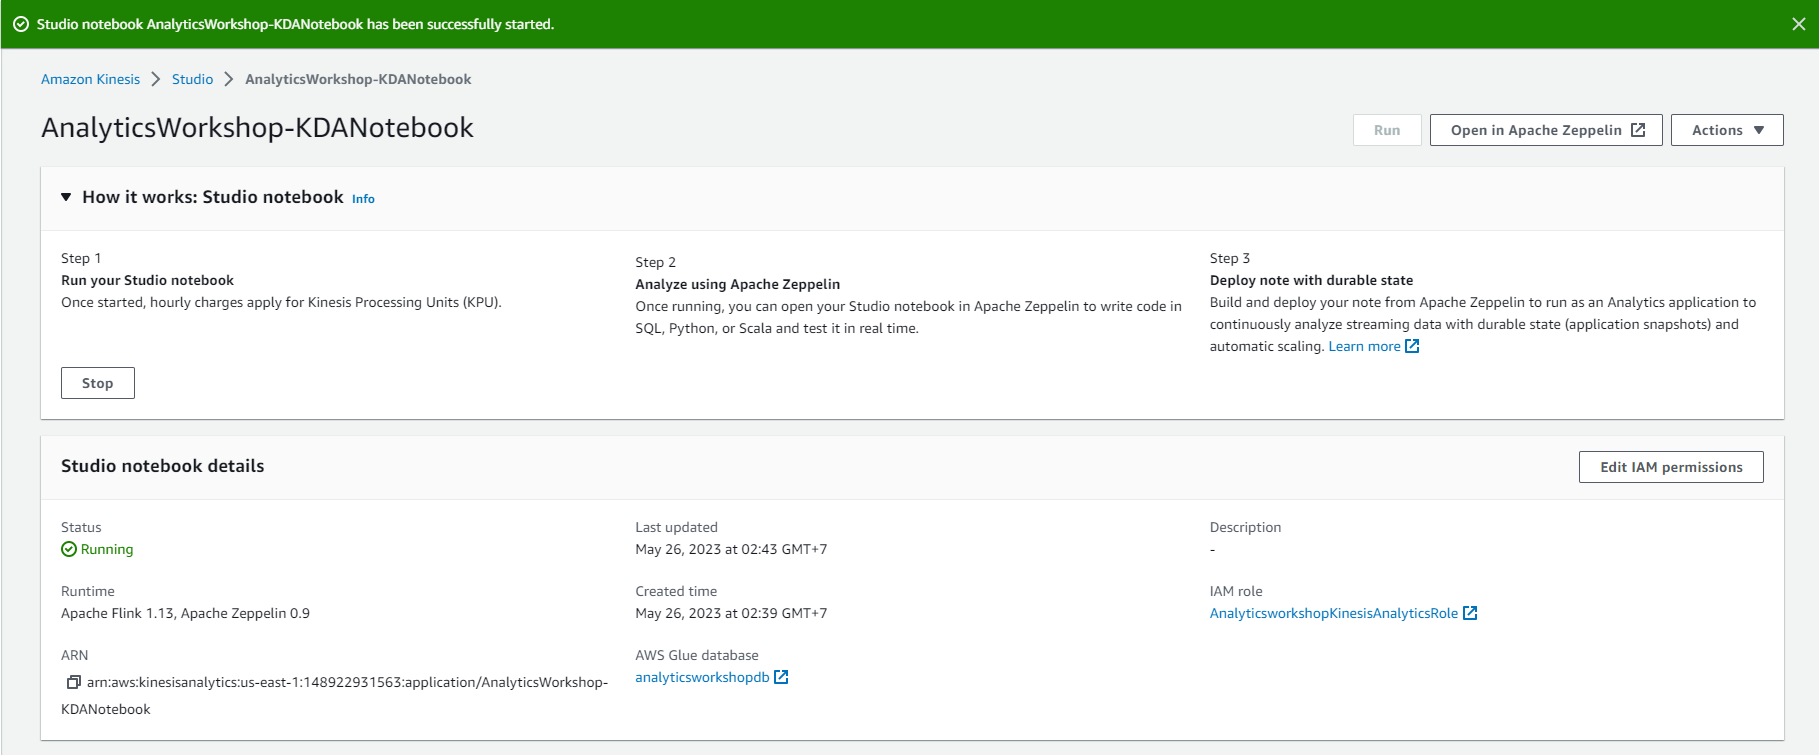
- Select Open in Apache Zeppelin in the upper right corner to open Zeppelin Notebook.
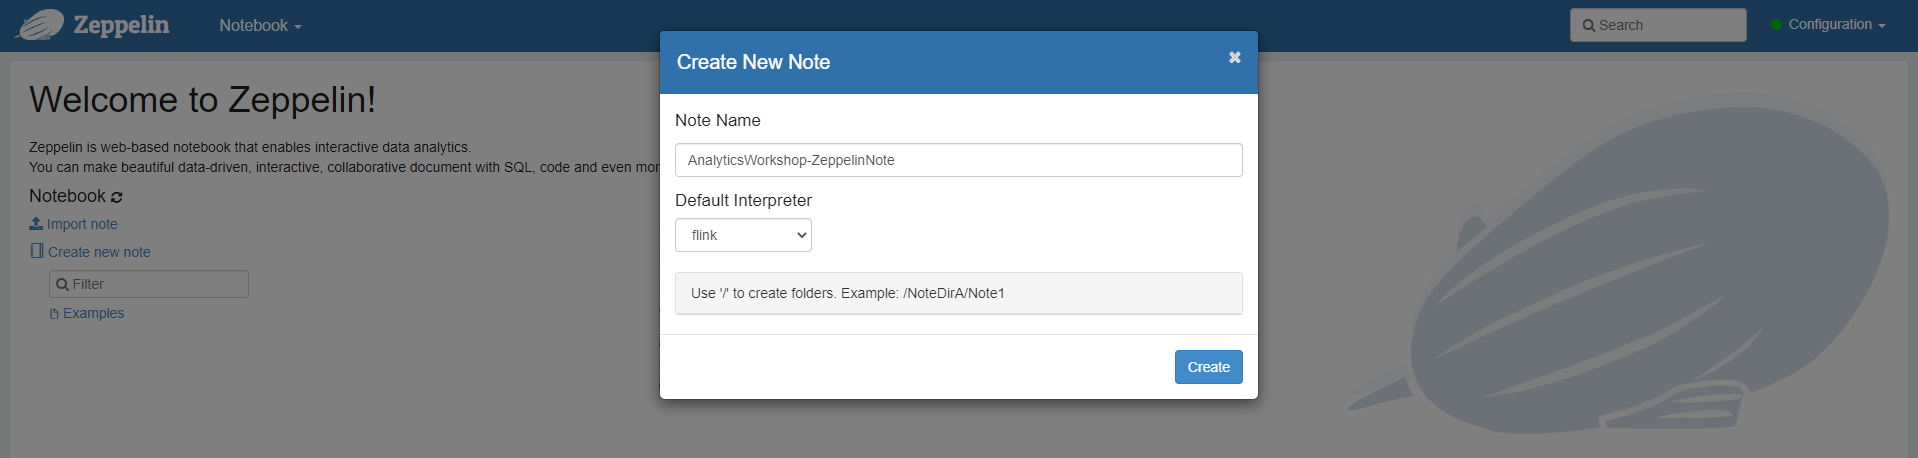
-
Select Create new note and name the note AnalyticsWorkshop-ZeppelinNote.
-
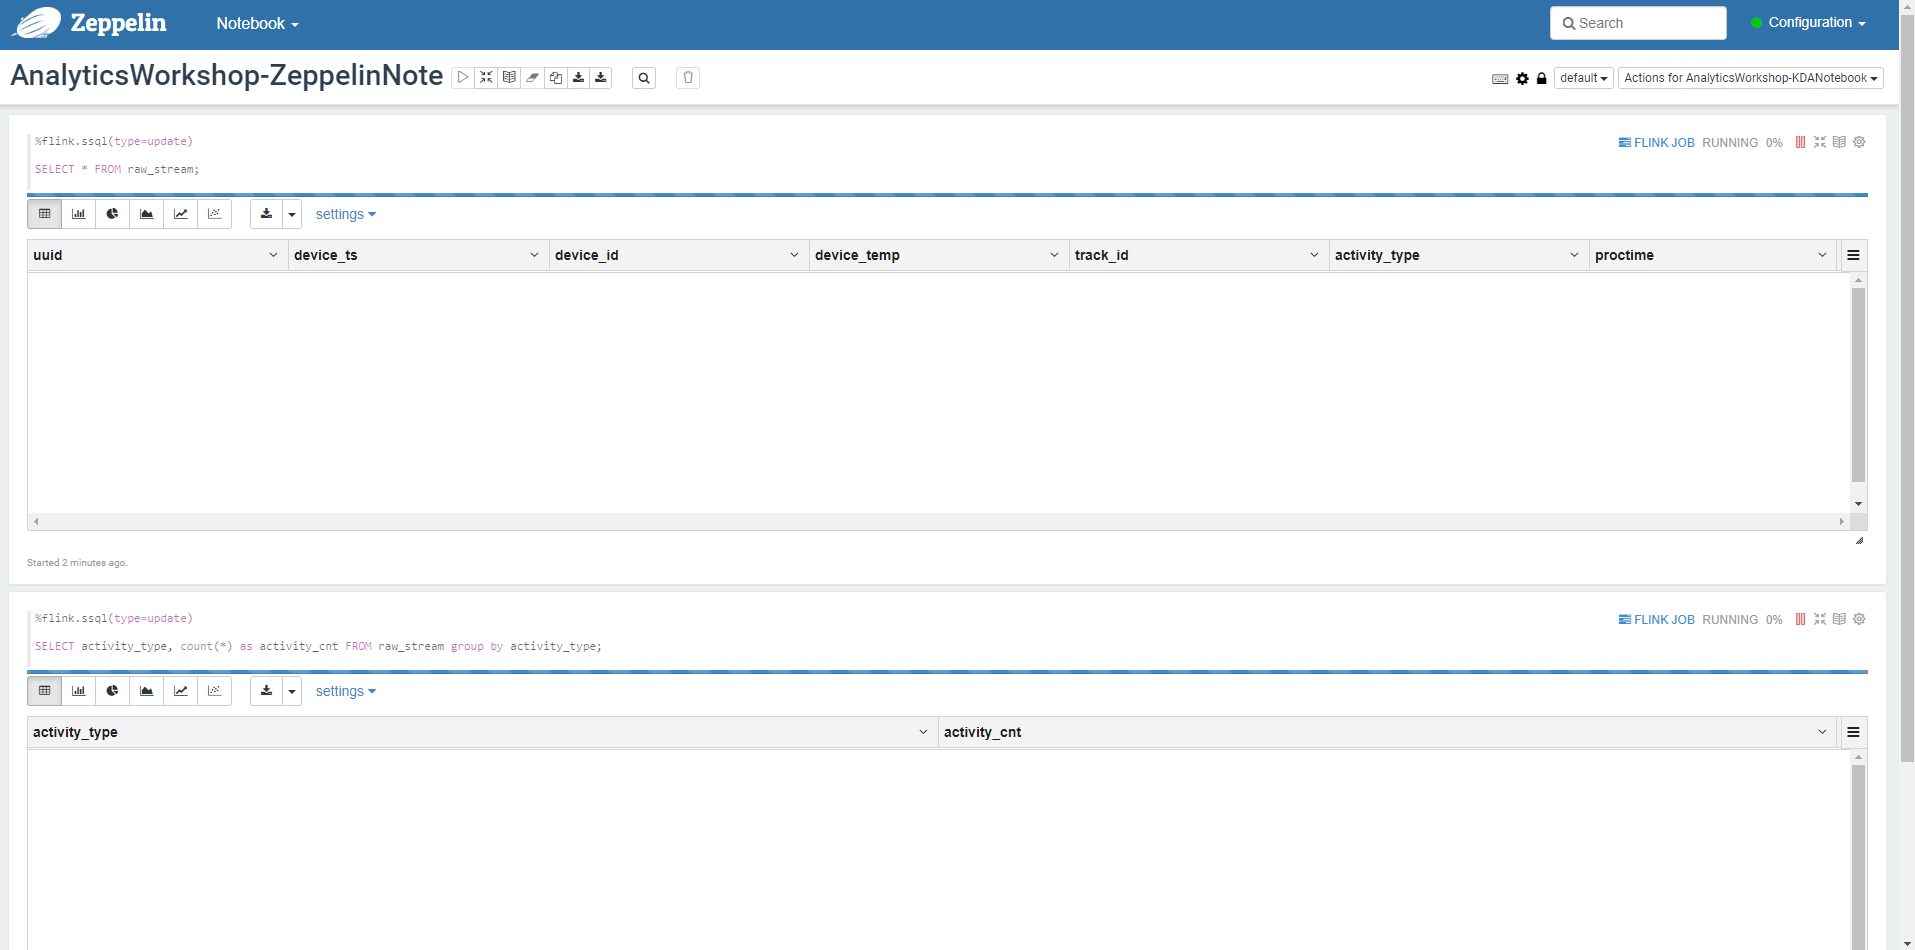
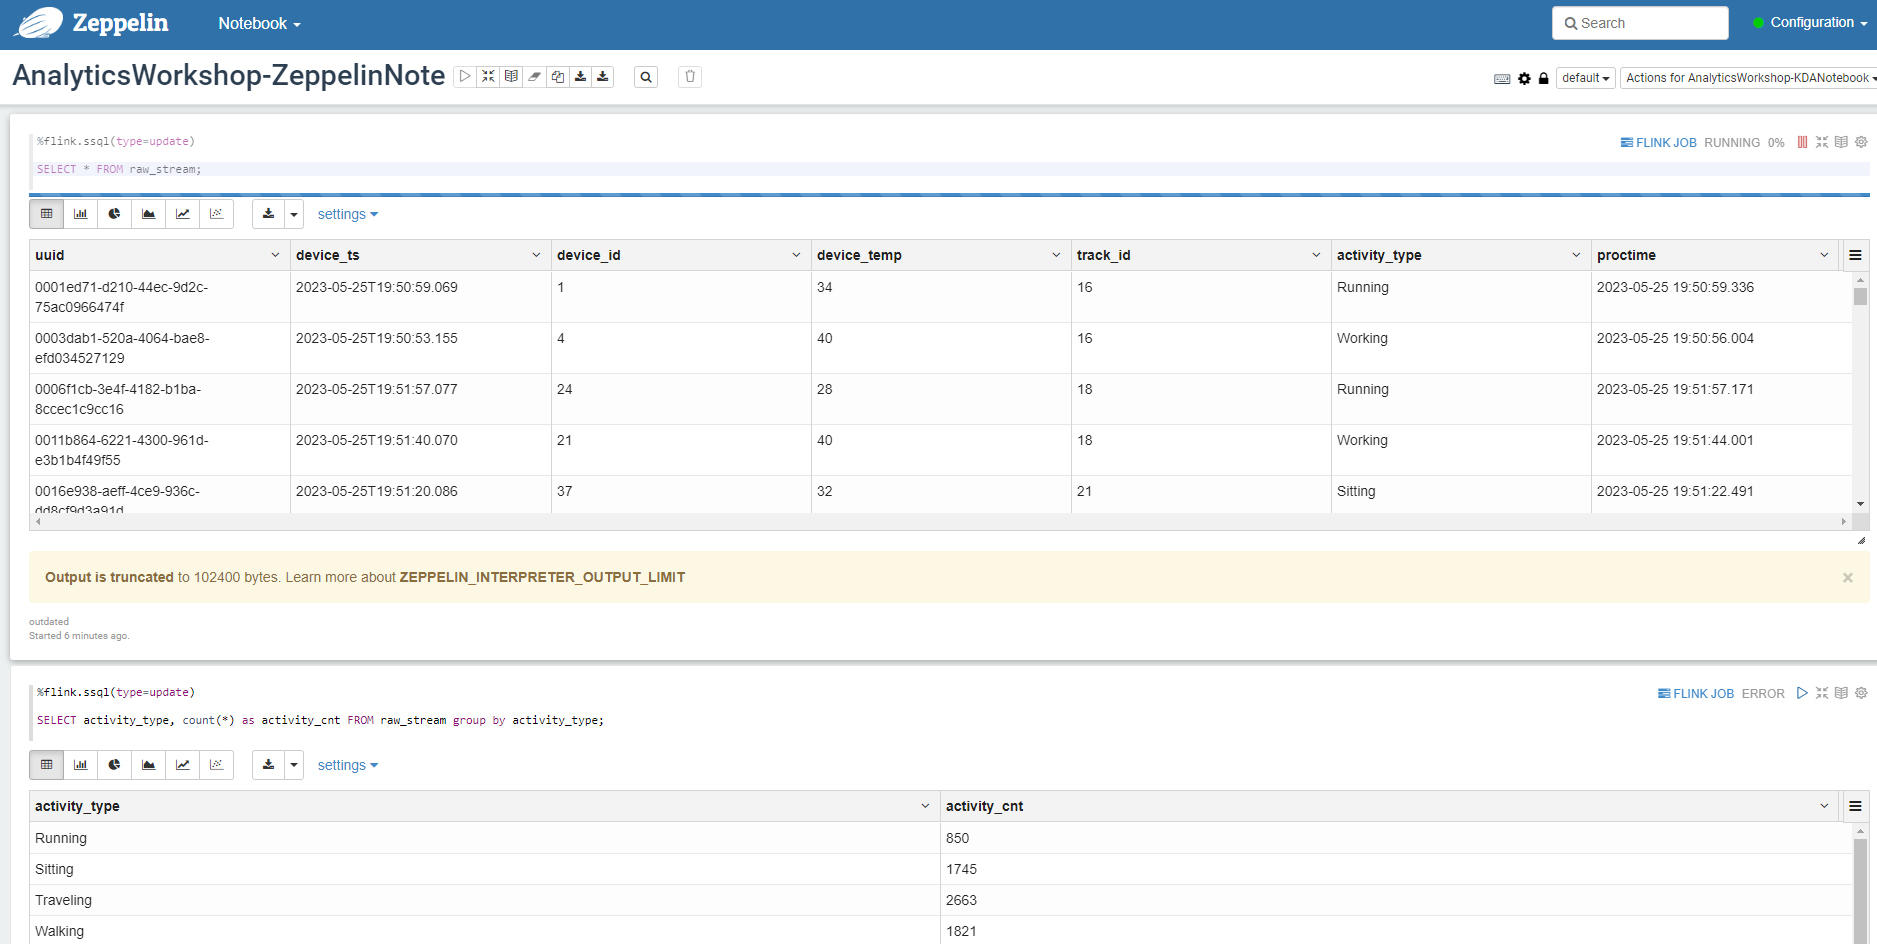
Paste this SQL query.
%flink.ssql(type=update)

SELECT * FROM raw_stream;
- This SQL query will list all the data streaming from our Kinesis Data Generator. type=update is a Flink interpreter for Zeppelin annotation syntax. In update mode, the output of the note will be continuously updated with new results.
%flink.ssql(type=update)

SELECT activity_type, count(*) as activity_cnt FROM raw_stream group by activity_type;
- This SQL query will count the number of operations being performed.
- When all queries are pasted, Select the Play button in the upper right corner of the paragraph.
Generate Dummy Data to Kinesis Data Stream
To display data from queries running in the Analytics Streaming notebook, we must send the original data from our Kinesis Data Generator.
- Go to KinesisDataGeneratorURL. You can find it in the Output tab of the Cloudformation stack.
- Login with your username and password
- Fill in the following information:
- Region: us-east-1
- Stream/delivery stream: analytics-workshop-data-stream (DO NOT select analytics-workshop-stream which you may have created in the module “Ingest and Store”)
- Make sure Records per second is Constant.
- Value for Records per second (Records per second): 100 (DO NOT change this number.)
- Make sure Compress Records is unchecked.
- Template record (Template 1): In the large text area, insert the following json template:
{
  "uuid": "{{random.uuid}}",
  "device_ts": "{{date.utc("YYYY-MM-DD HH:mm:ss.SSS")}}",
  "device_id": {{random.number(50)}},
  "device_temp": {{random.weightedArrayElement(
    {"weights":[0.30, 0.30, 0.20, 0.20],"data":[32, 34, 28, 40]}
  )}},
  "track_id": {{random.number(30)}},
  "activity_type": {{random.weightedArrayElement(
        {
            "weights": [0.1, 0.2, 0.2, 0.3, 0.2],
            "data": ["\"Running\"", "\"Working\"", "\"Walking\"", "\"Traveling\"", "\"Sitting\""]
        }
    )}}
}
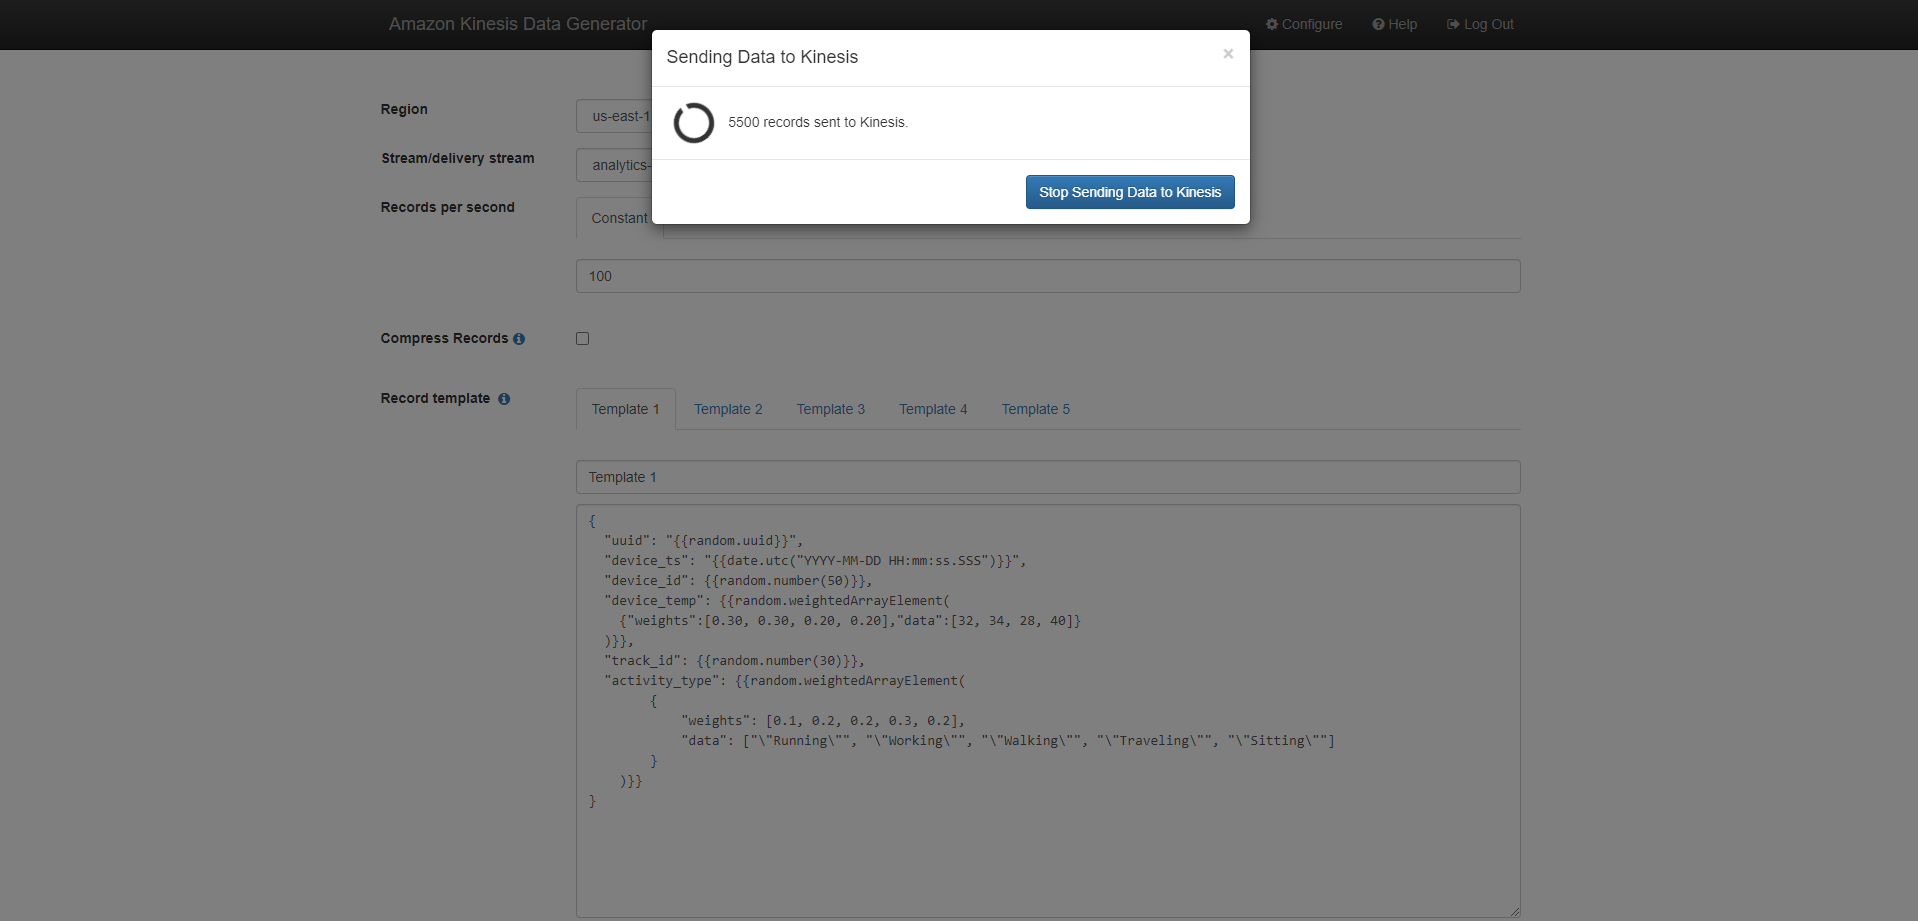
- Then, Select Send Data.
- NOTE: DO NOT PAUSE after Select to Send Data as this is necessary for a continuous flow of data for analysis in Zeppelin notebooks.
- Return to Zeppelin notebook. our. Wait a few minutes, the results will be displayed.
In this module, you created a Kinesis Data Stream to receive stream data from the Kinesis Data Generator, a Glue table that stores Kinesis Data Stream data and schema information, and a Kinesis Analytics Studio Notebook application that reads and parses stream data.
Next, we will learn how to build charts/dashboards using Amazon Quicksight.